Marketing analytics 05 / B2B services / Sales analytics
Lead Quality, Not Just Lead Volume
A customer conversion dashboard connecting traffic source, country and sales owner to lead quality, so marketing and sales could argue from the same numbers.
- My role
- Project lead and planner
- Period
- Apr 2024 - Sep 2025
- Engagement
- In-house marketing at Golden Owl Solutions
Business objective: Give marketing and sales a consistent view of lead quality, source performance and sales progression.
My ownership: I led planning and delivery: translated management objectives into project KPIs and milestones, allocated work and resources, trained and guided contributors, and owned progress against the agreed targets.
B2B lead quality and sales progression
Source, geography and sales ownership help an agency understand whether enquiries match its offer. The insight should return to audience choices, channel allocation and sales follow-up.
Professional work at Golden Owl · Apr 2024–Sep 2025. Professional dashboards used GA4, Looker Studio and Excel; Power BI belongs to independent project work.
Marketing reported lead volume; sales reported that most leads went nowhere. Neither team could see the other's definition. The dashboard was built to hold both: where a lead came from, which country and sales owner it landed with, and what happened to it afterwards — so that “good lead” became a measurable category rather than an opinion.
Lead quality varies far more by source and country than by volume, so optimising for total leads was actively misleading. Making source, country and sales-team outcome visible in one view shifted the conversation from how many leads marketing generated to which sources produced leads that closed — improving lead conversion efficiency by an estimated 10–20% and raising the share of high-quality leads by 15–25%.
What the evidence says
What the shared view changed.
Source, not volume, predicted lead quality
Breaking conversion out by traffic source showed that the highest-volume sources were not the highest-converting ones, which reframed budget discussions away from raw lead counts.
Evidence: lead conversion by traffic sourceCountry segmentation exposed uneven fit
Conversion performance differed sharply by country, indicating that some markets produced enquiries that rarely matched the service offer.
Evidence: lead conversion by countrySales-team view made follow-up quality visible
Splitting outcomes by sales owner identified differences for follow-up review. Source mix, lead assignment and response timing remain possible explanations; this view does not isolate owner performance.
Evidence: conversion outcome by sales team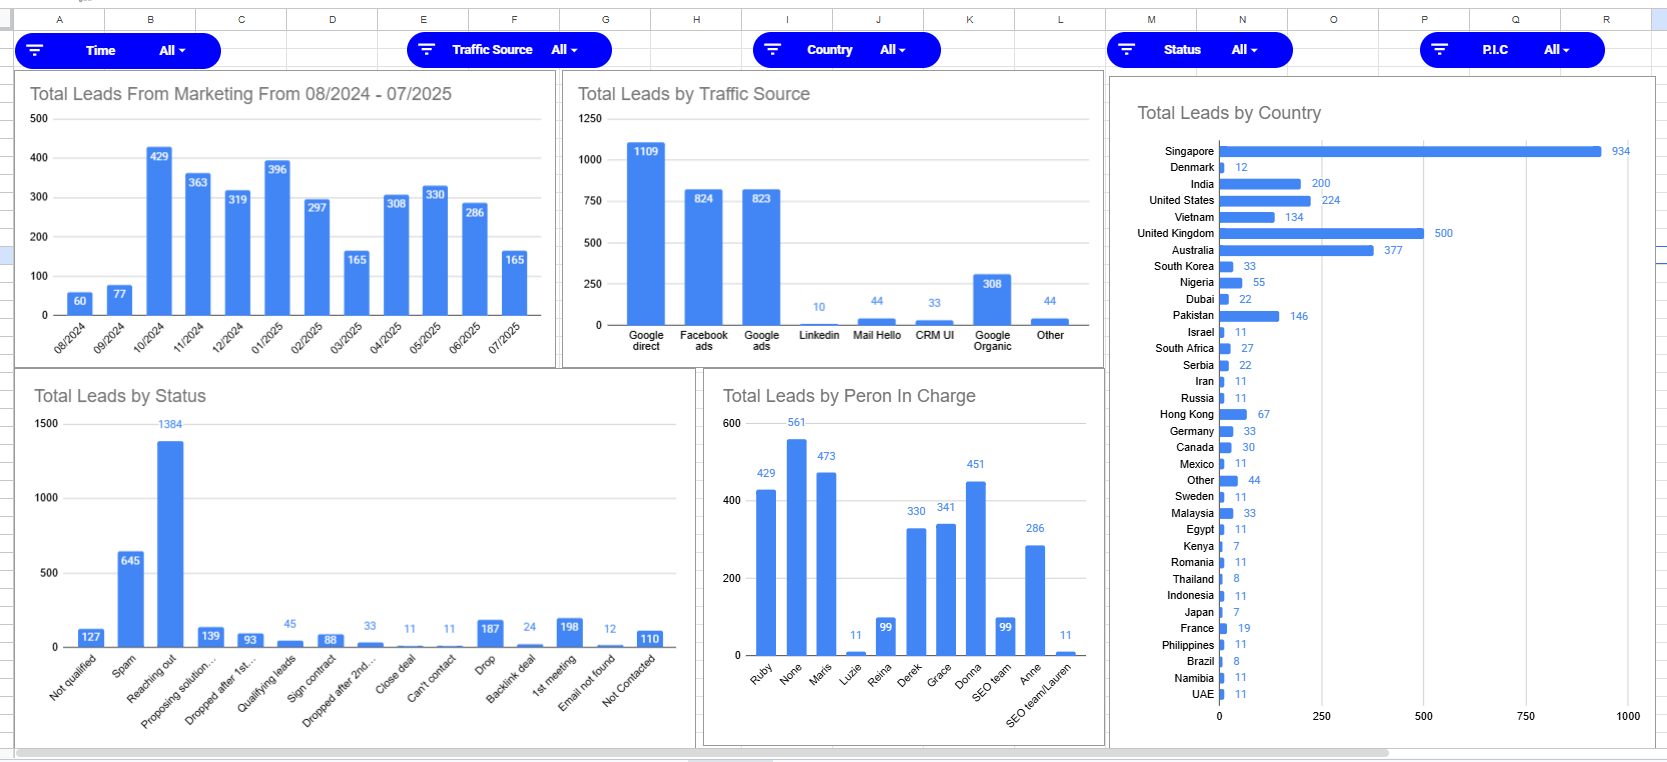
- Weight acquisition budget toward the sources that produce closing leads, not the sources that produce the most leads.
- Use explicit service eligibility and customer need for qualification. Country-level differences require mix and sample-size review before influencing treatment.
- Review marketing and sales against the same definitions, then investigate lead mix, assignment and follow-up timing before attributing differences.
- Keep a single shared definition of a qualified lead in the reporting layer rather than in each team's spreadsheet.
- CRM lead records joined to acquisition source so marketing and sales data share one lead key.
- Conversion measured at the qualified-lead stage rather than at form submission.
- Cuts by traffic source, country and sales owner exposed on the same page for direct comparison.
- Definitions documented in the dashboard so each team reads the same metric the same way.
- Impact figures are estimated ranges attributed to the reporting change, not results of a controlled test.
- CRM stage data depends on consistent manual updating by the sales team.
- Underlying client data is confidential; only the aggregate view is shown here.