Marketing analytics 01 / E-commerce / GA4
Growth Was Happening, But Its Quality Was Uneven
A 100,000-row GA4 analysis covering acquisition, segmentation, funnel performance and retention for a Vietnamese tech e-commerce retailer.
- My role
- Project lead and planner
- Period
- Jul - Dec 2025
- Engagement
- Freelance engagement
Business objective: Identify channel, product-funnel and retention priorities for e-commerce growth.
My ownership: I led planning and delivery: translated management objectives into project KPIs and milestones, allocated work and resources, trained and guided contributors, and owned progress against the agreed targets.
Retail ecommerce and electronics
Connect channel acquisition, product selection, cart progression and repeat behaviour to retail growth. This professional engagement provides commercial context for the independent TheLook BI study.
Professional work · Jul–Dec 2025. Observational findings support recommendations; they do not establish measured uplift from a launched intervention.
The business wanted growth, but “more traffic” was not a specific enough answer. Using a 30-day GA4 export across session, user, item and transaction levels, the analysis was framed around three linked questions: are we attracting the right users, are we converting them efficiently, and are we keeping them long enough to be worth the acquisition cost?
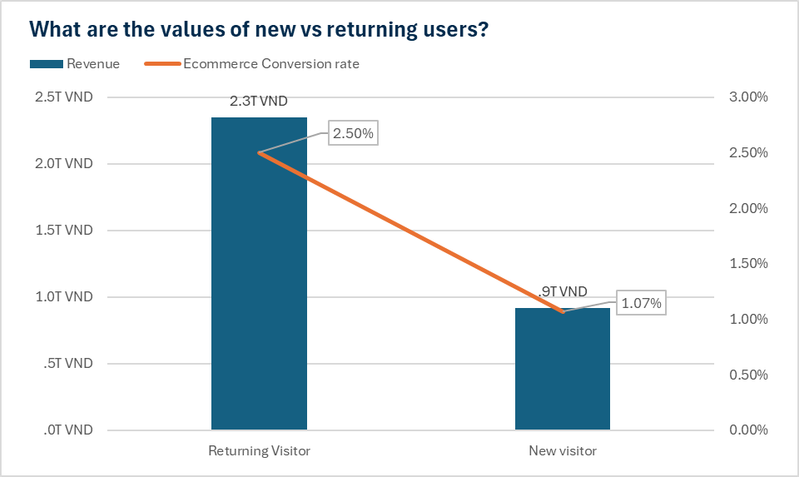
Acquisition is stable overall but the mix is deteriorating: mobile drives traffic growth while desktop weakens on SEO. The largest audience (18–24) is not the most valuable one (25–34), and desktop monetises far better than mobile even though mobile drives discovery. The largest observed step-to-step drop-off sits in the mid-funnel — only 21.5% of product-page visitors reach the cart — not at checkout, which converts at 63.5%. Returning users converted at 2.50% versus 1.07% for new users. This supports testing retention opportunities; it does not establish their incremental return relative to acquisition.
What the evidence says
Four findings, written for the decision.
SEO is still the largest channel, but desktop is losing it
Google Organic drives 44% of desktop traffic and declined 15% year on year. Other channels grew but not enough to offset it. Mobile shows the opposite pattern, with SEO up 30% and paid and referral expanding quickly.
Evidence: desktop and mobile channel breakdown, YoY sessions and bounce ratePaid Search acquisition is associated with later organic revisits
Among paid channels, Google Paid Search contributes the most to later organic revisits, and the association is strongest above 14 sessions. Google Display contributes the least in this view. Channel spend, customer mix and incremental outcomes are needed before reallocating budget.
Evidence: organic revisit rate by acquiring channel and session countThe largest segment and the most valuable segment are not the same
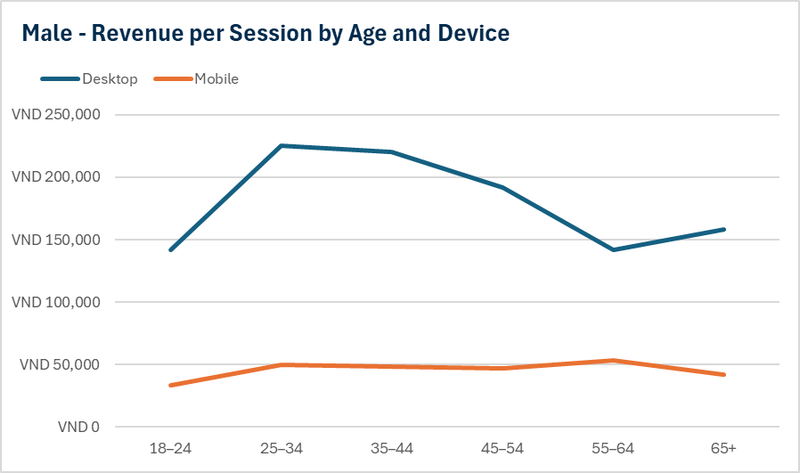
18–24 users supply 51.5% of sessions, but 25–34 users generate the highest revenue per session, and they peak on desktop. Brand affinity splits cleanly by gender: male users over-index on Samsung (40.7%) and Xiaomi (26.8%), female users on Apple (30.4%) and OPPO (19.8%).
Evidence: revenue per session by age, gender and device; brand share by genderThe funnel leaks before checkout, not at it
Only 21.46% of product-page visitors move to cart and only 27.47% of cart visitors continue to checkout, while checkout converts to purchase at 63.46%. Depth of browsing predicts intent: sessions with 3+ pageviews, about a quarter of all sessions, convert materially better.
Evidence: five-step funnel counts; conversion rate by pageview and duration bucket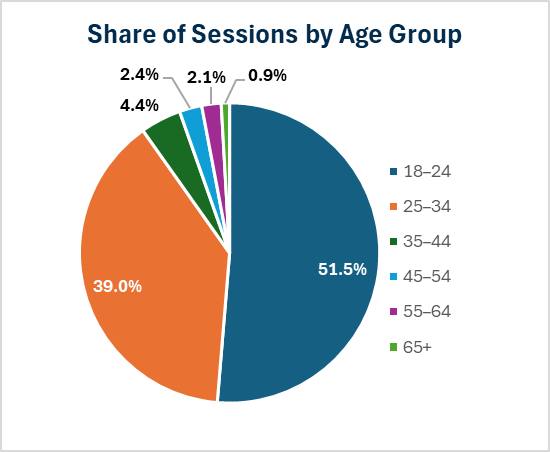
- SEO: recover desktop rankings on the highest-impact pages and keywords to restore the largest single traffic source.
- Performance marketing: test Google Paid Search and mobile prospecting against acquisition cost and downstream value; review Google Display before changing spend.
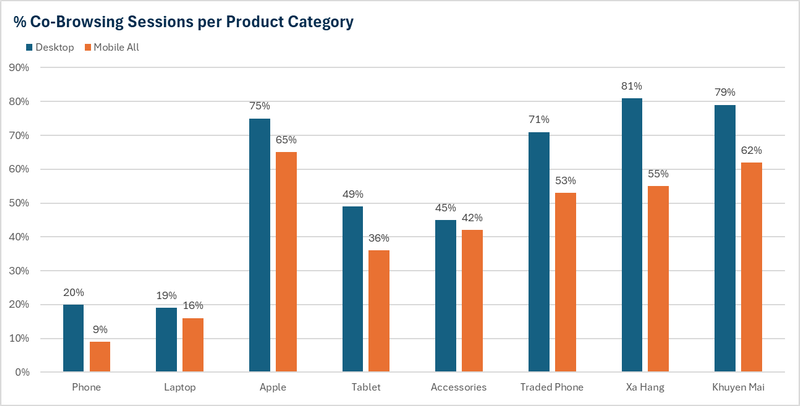
- Merchandising: build visibility and promotions around 25–34 users, mobile explorers and desktop converters, and use high co-browsing categories as discovery hubs.
- UX / CRO: attack the Product Page and Cart Page specifically — clearer CTAs, better decision support, promo visibility, smoother mobile browse-to-buy.
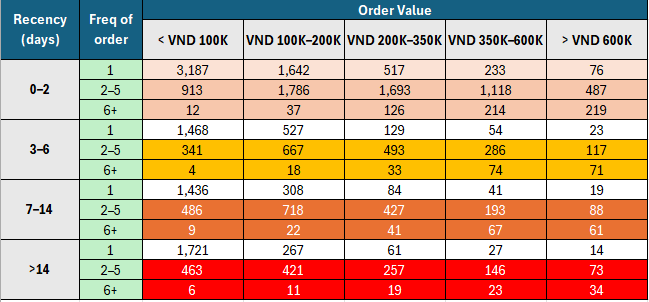
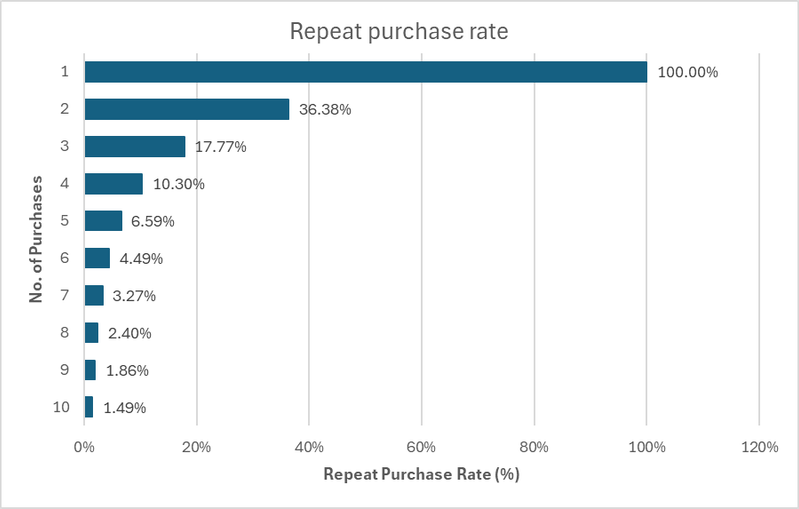
- CRM: concentrate retention effort on sessions 1 to 6, where the sharpest drop-off happens, using RFM segments to route the offer.
- Analytics: report value-based KPIs (revenue per session, page depth, revisit rate, time to next purchase) rather than traffic volume alone.
- GA4 export of roughly 100,000 rows spanning session, user, item and transaction grain.
- Five working tables: traffic sessions, user profile summary, page and funnel events, e-commerce item transactions, and an analyst-derived segment table.
- Revenue per session decomposed as AOV × conversion rate so device and segment effects stay separable.
- Funnel measured step to step (catalog, product, cart, checkout, purchase) rather than against a single denominator.
- RFM segmentation built on recency buckets, order frequency and order value bands.
- The window is 30 days during a seasonal demand peak, so year-round behaviour may differ.
- Revenue impact figures in the deck are expected ranges from the recommendation set, not measured outcomes.
- Analysis is observational; no experiment established that the recommended changes cause the modelled lift.