Flagship · Commercial warehouse
TheLook — commercial reporting layer
Two source systems reconciled onto one country-month grain, with 35 automated checks deciding what is allowed to reach a dashboard.
- My role
- Independent analyst · Sole contributor
- Period
- 2026 · Approximately 1 month
- Engagement
- Self-directed case study; completed individually
Business objective: Build a commercial reporting layer that answers whether the business will land the number, and prove every figure in it.
My ownership: I completed this project independently from end to end: framed the question, prepared and validated the data, performed the analysis, built the reporting output, and wrote the recommendations and limitations.
A commercial team has to answer one question every month: are we going to land the number, and if not, which market is the problem? Answering it needs two things the transactional data does not contain on its own — a plan to compare against, and confidence that the comparison is like for like.
The plans arrive as regional submissions in five currencies. The transactions arrive as seven files and 2.42 million events. Nothing joins them.
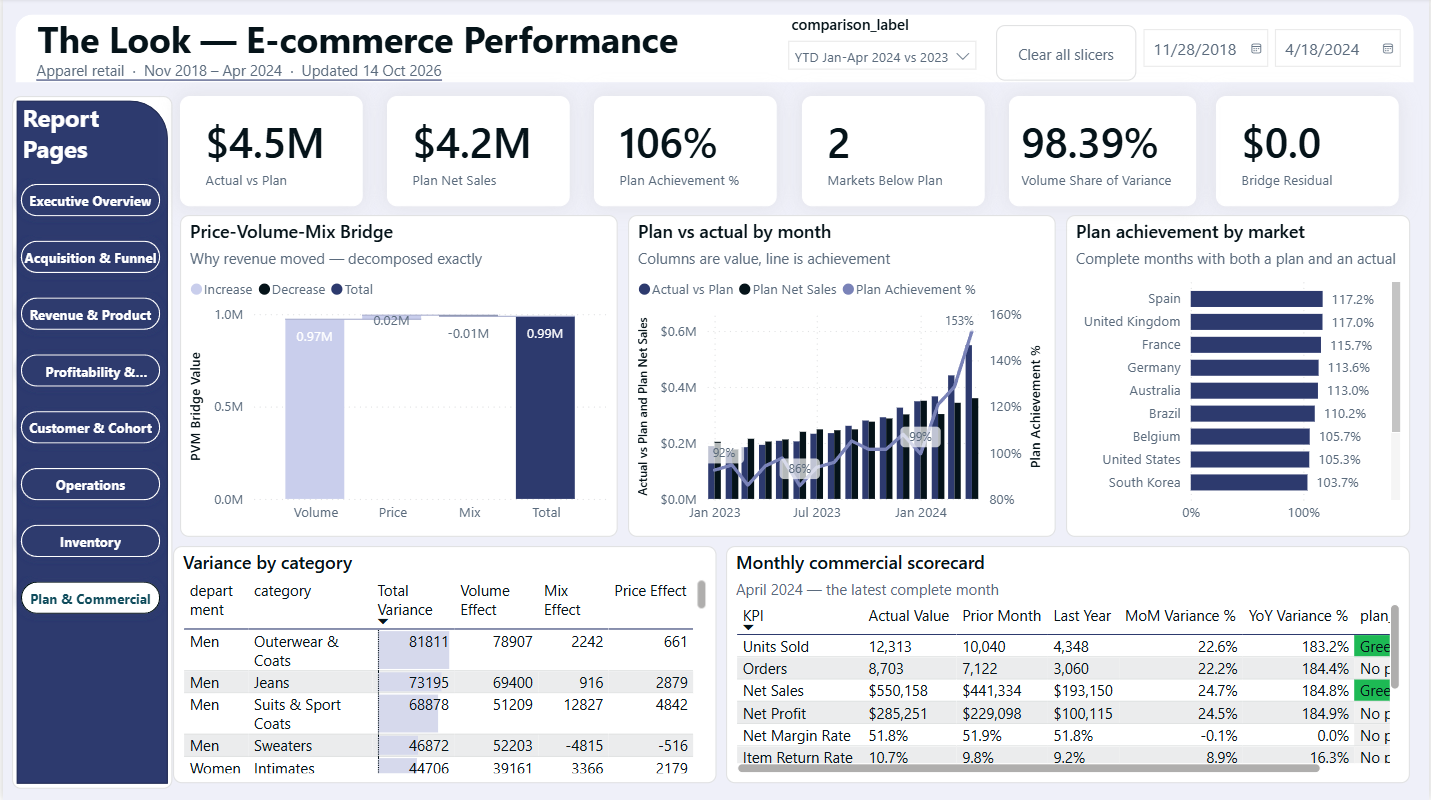
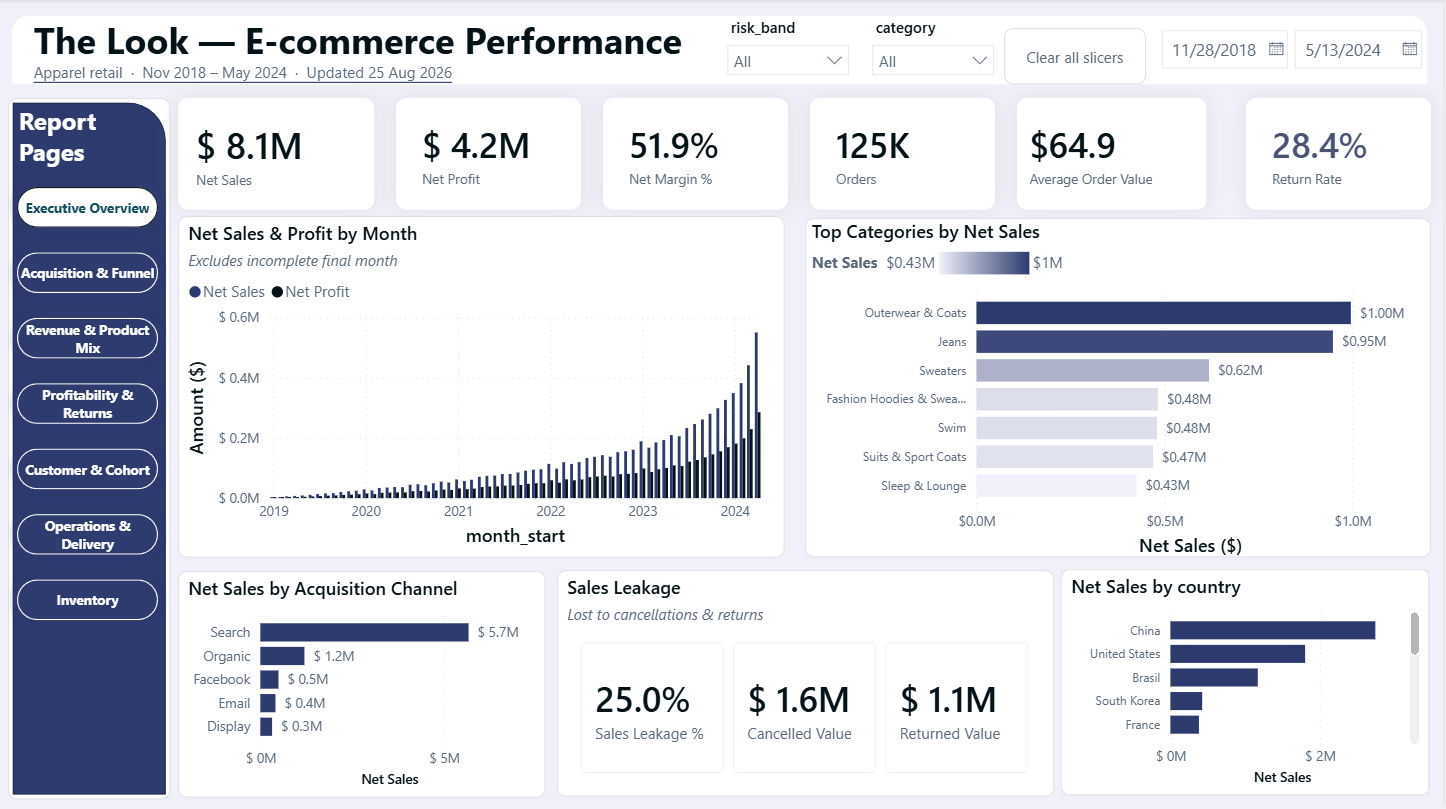
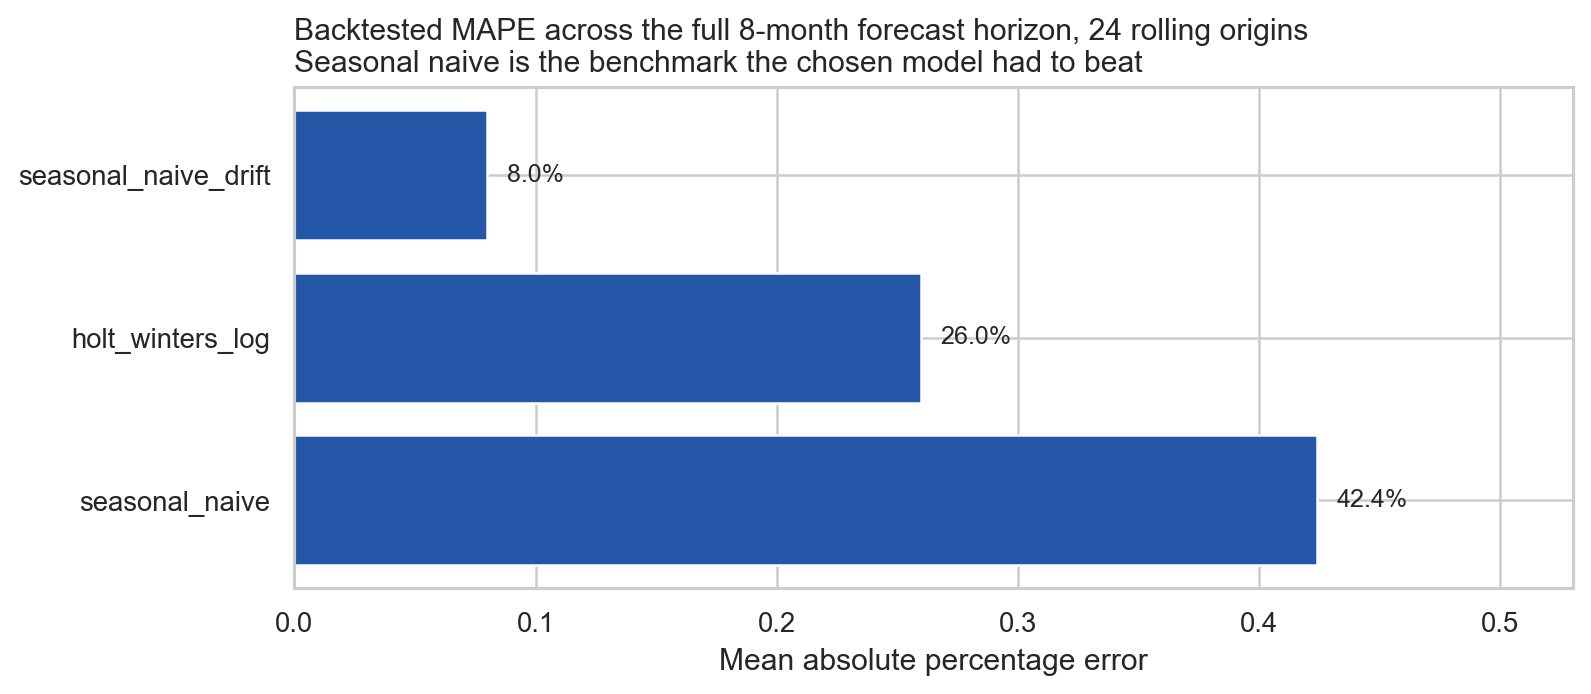
Two source systems reconciled onto one country-month grain, rebuilt from seven source files by a single command. 35 checks across three gates decide what reaches a dashboard, a reconciliation statement balances at every stage, and a price-volume-mix bridge resolves to the cent. The forecast was held back until it had been audited — the audit found two defects in my own code, and the rebuilt model reaches 8.0% MAPE across 192 rolling-origin folds.
- A layered warehouse. raw → stg → core → mart, ten SQL modules run in dependency order, rebuilt from the seven source CSVs by a single command. 680,862 sessions rebuilt from raw events; a conformed star schema; net sales, profit and margin defined once in
coreand never redefined downstream. - A second source, harmonised. Regional plan submissions converted at a fixed budget FX rate and mapped onto a committed country master. The source carried 15 spellings for 13 markets — a genuine master-data defect, resolved with a seed file and a gate that catches the sixteenth.
- Checks that stop a build. 35 checks across three gates, with a stated rule for what blocks and what quarantines and warns. Blocking failures raise
QualityGateFailedand the pipeline stops rather than publishing. - A reconciliation statement. Not a log — a statement a reviewer can audit without reading any code: 292 plan rows submitted, 5 quarantined, 287 accepted, money tying at every stage, with the expectation printed beside each row.
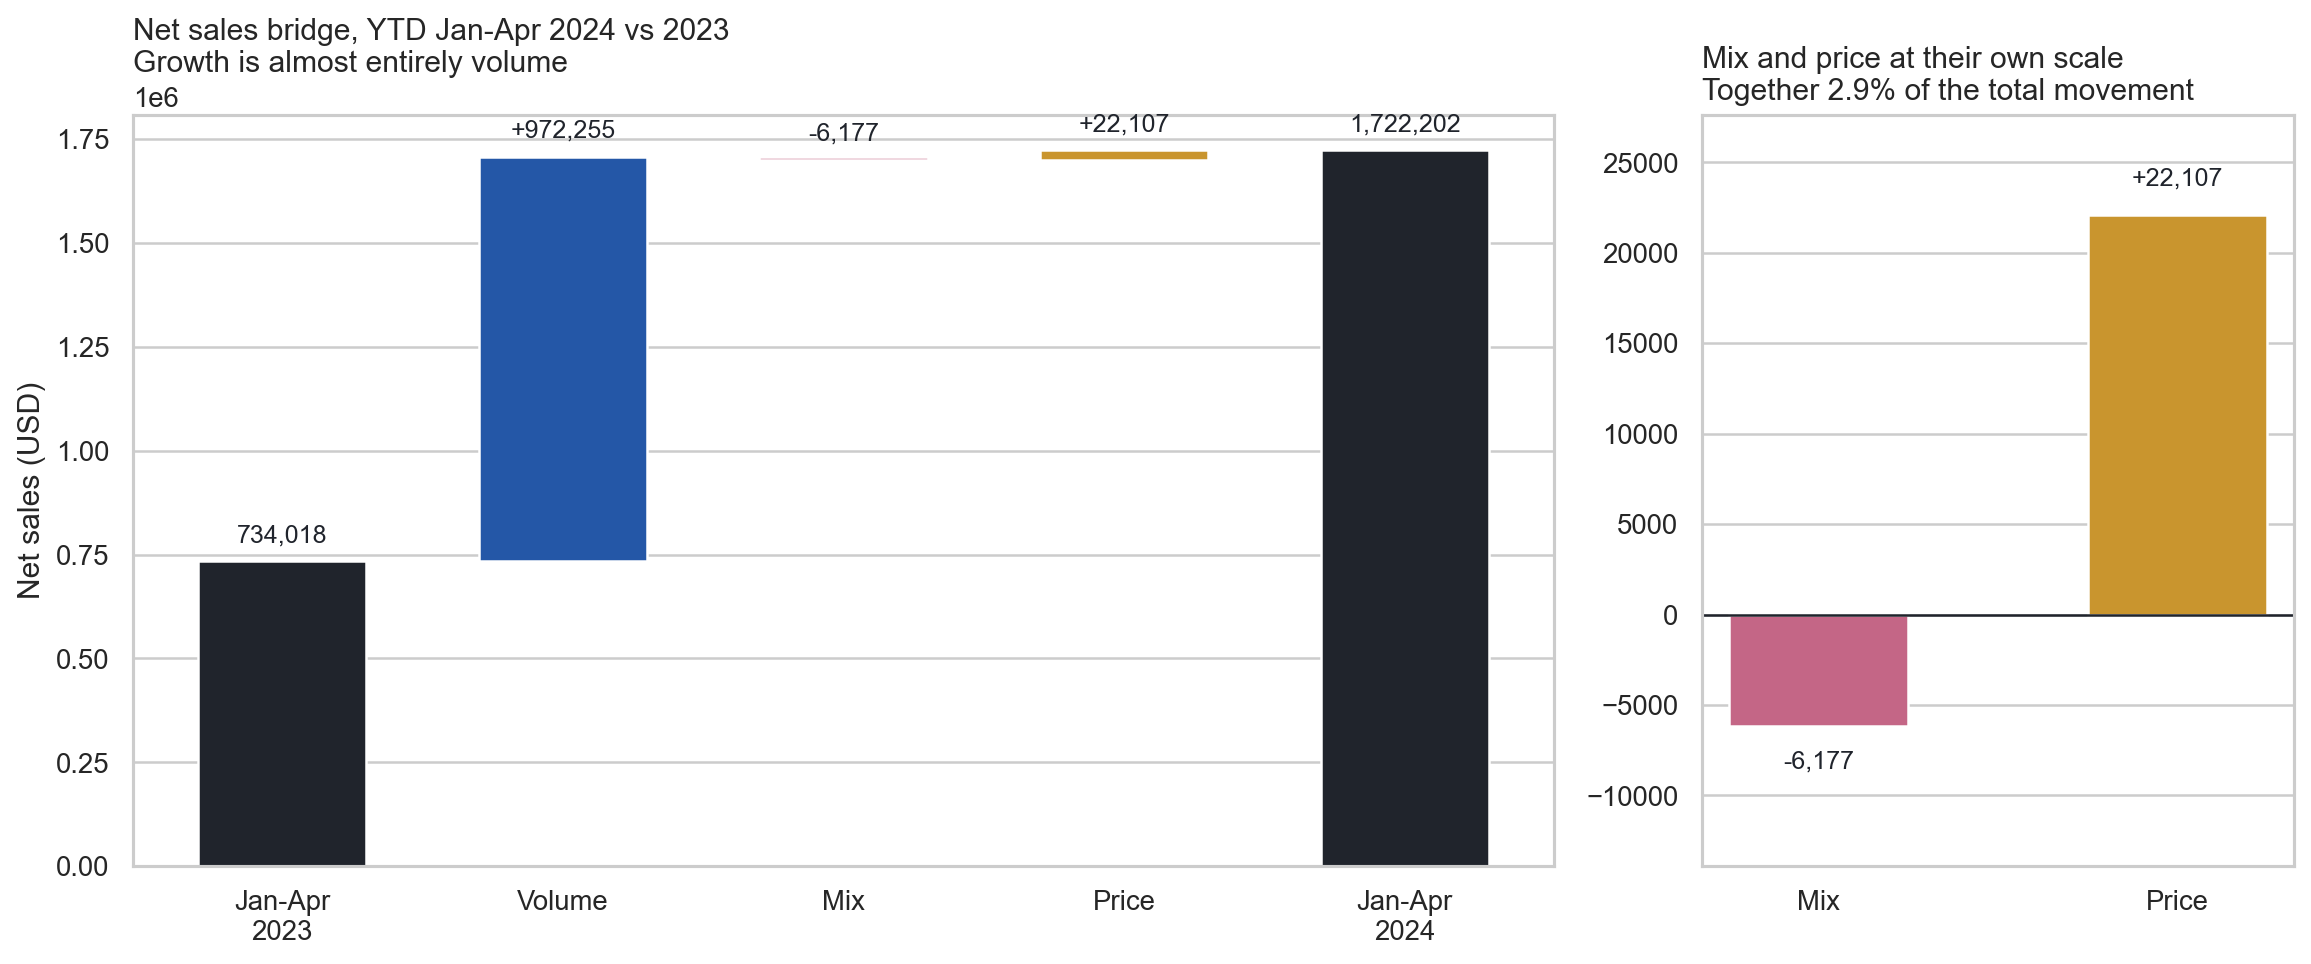
- A price-volume-mix bridge. Three-way decomposition across three comparisons, with a residual that must be zero. It is, to the cent.
What the evidence says
What it found.
A sign error the dashboard did not show
Belgium's plan variance looked unremarkable on the dashboard. The reconciliation statement caught it, because a statement that has to balance catches things an eye scanning a chart does not.
Concentration depends on who you count
Gini of 0.58 across all customers who placed an order. But 17% of them contributed zero net revenue — everything they bought was cancelled or returned. Excluding them: 0.49. I state which population I used, because a concentration figure without one is meaningless.
Two defects in my own forecasting code
Seven checks specified before any were run. The backtest scored every model one month ahead and the forecast then ran the winner eight months ahead — and over six folds the two serious candidates split them three-three. A coin flip that happened to land right. Rebuilt to 24 origins × 8 steps = 192 folds; the selected model reaches 8.0% MAPE.
Two hypotheses I expected to confirm, rejected
I thought exponentiating a mean of logs would bias Holt-Winters low — measured bias was +0.6%. I thought MAPE's asymmetry might be choosing the model for the wrong reason — four metrics rank them identically. Both are published as rejected. A review that confirms everything it suspected is not a review.
What it looks like
The output, not a description of it.
- The plan is constructed. TheLook ships no budget data, so the planning file is generated from a published deterministic rule. Every number derived from plan-versus-actual inherits that.
- The forecast MAPE is optimistic. Synthetic growth is far smoother than real demand — no promotional spikes, no stockouts, no competitor doing something in week three.
- Net margin is flat at 51.8% every month. That is a property of how the dataset was generated, not a commercial finding, and it is named as such wherever margin appears.
- There is no price variation in the source, so no elasticity work is possible here. That is why the pricing project uses different data.
- The return-propensity model failed — AUC 0.50, a coin flip. The recommendation is better outcome logging, not a different algorithm. The notebook is still in the repository.