Phan Hoai Thu (Katherine)

Commercial Data Analyst

Plan vs actual · Price-volume-mix · Reconciliation

I build the reporting layer commercial teams run on — plan versus actual, price-volume-mix, margin, and channel efficiency — and the controls that prove it reconciles. Where sell-in disagrees with sell-out, or finance and commercial quote different revenue, somebody has to find out which number is correct and be able to show their working.

I build Plan vs actualPrice-volume-mixMargin & channel P&LPricing & promotion
Tools SQLPower BIPythonBigQueryGA4Excel
I prove it with Multi-source reconciliationData-quality gatesStated populationsBacktesting
Phan Hoai Thu at The Future of Artificial Intelligence event
My operating principle Trust the chain Question → Evidence → Decision → Impact
5commercial case studies
3+years across e-commerce & SaaS
70+analyses delivered
250K+monthly users supported

Selected work

Five projects. One question each.

View all projects

E-commerce

01Commercial warehouse / Reporting layer

2026 · Approximately 1 month · Sole contributor

TheLook — commercial reporting layer

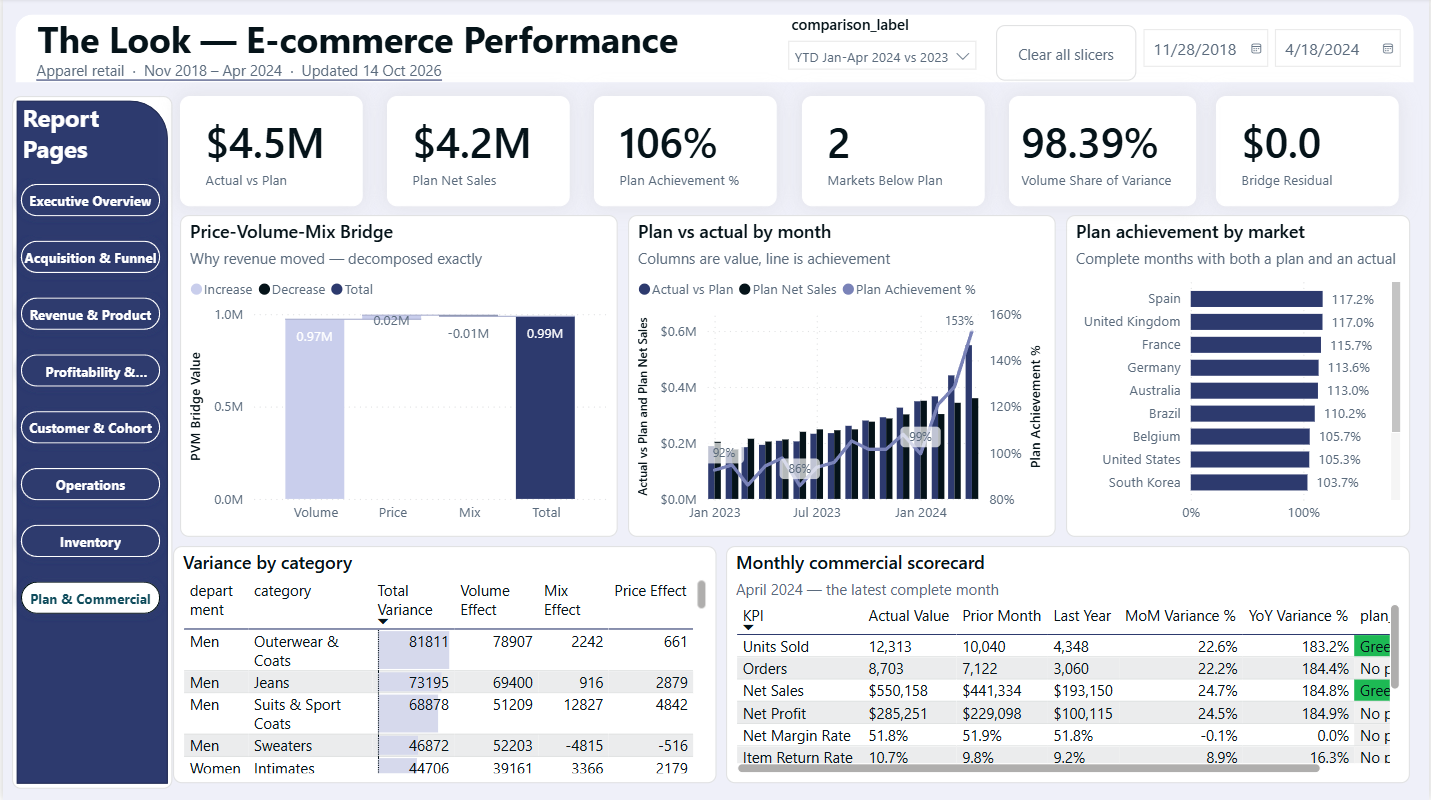
Two source systems reconciled onto one country-month grain. 35 checks across three gates decide what reaches a dashboard, and the forecast was held back until an audit had found two defects in my own code.
DuckDB SQL Python Power BI Reconciliation

Grocery retail

02Causal inference / Price economics

2026 · Approximately 2 weeks · Sole contributor

Dunnhumby — elasticity and promotion effectiveness

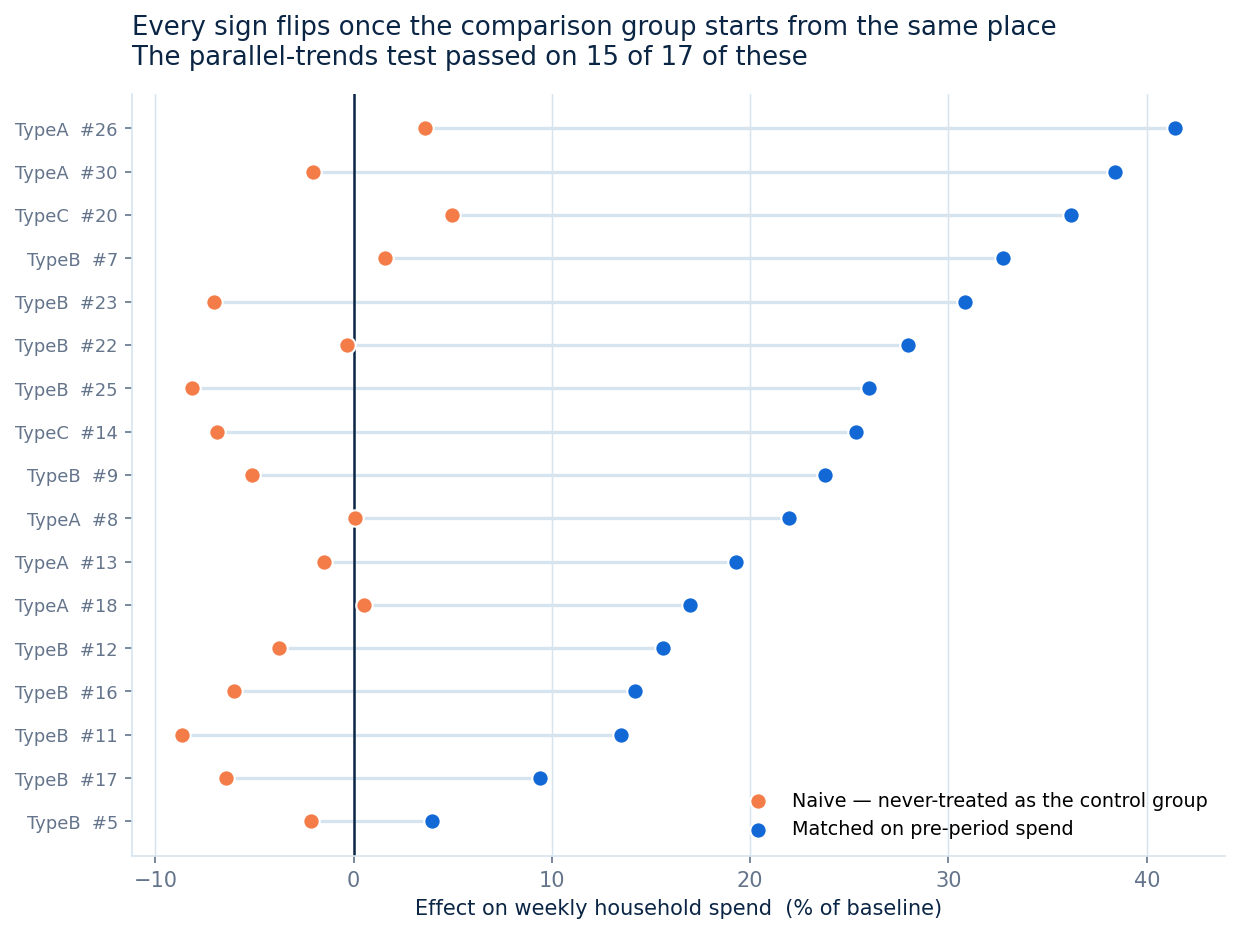
Own-price elasticity for 147 categories. The campaign evaluation’s first answer said coupons reduced spend and the standard check endorsed it; matched on pre-period spend, every sign flips.

Two-way fixed effects Difference-in-differences Matching Python

Mobility & delivery

03Channel P&L / Real operating data

2026 · Approximately 2 weeks · Sole contributor

BE Group — marketing channel economics

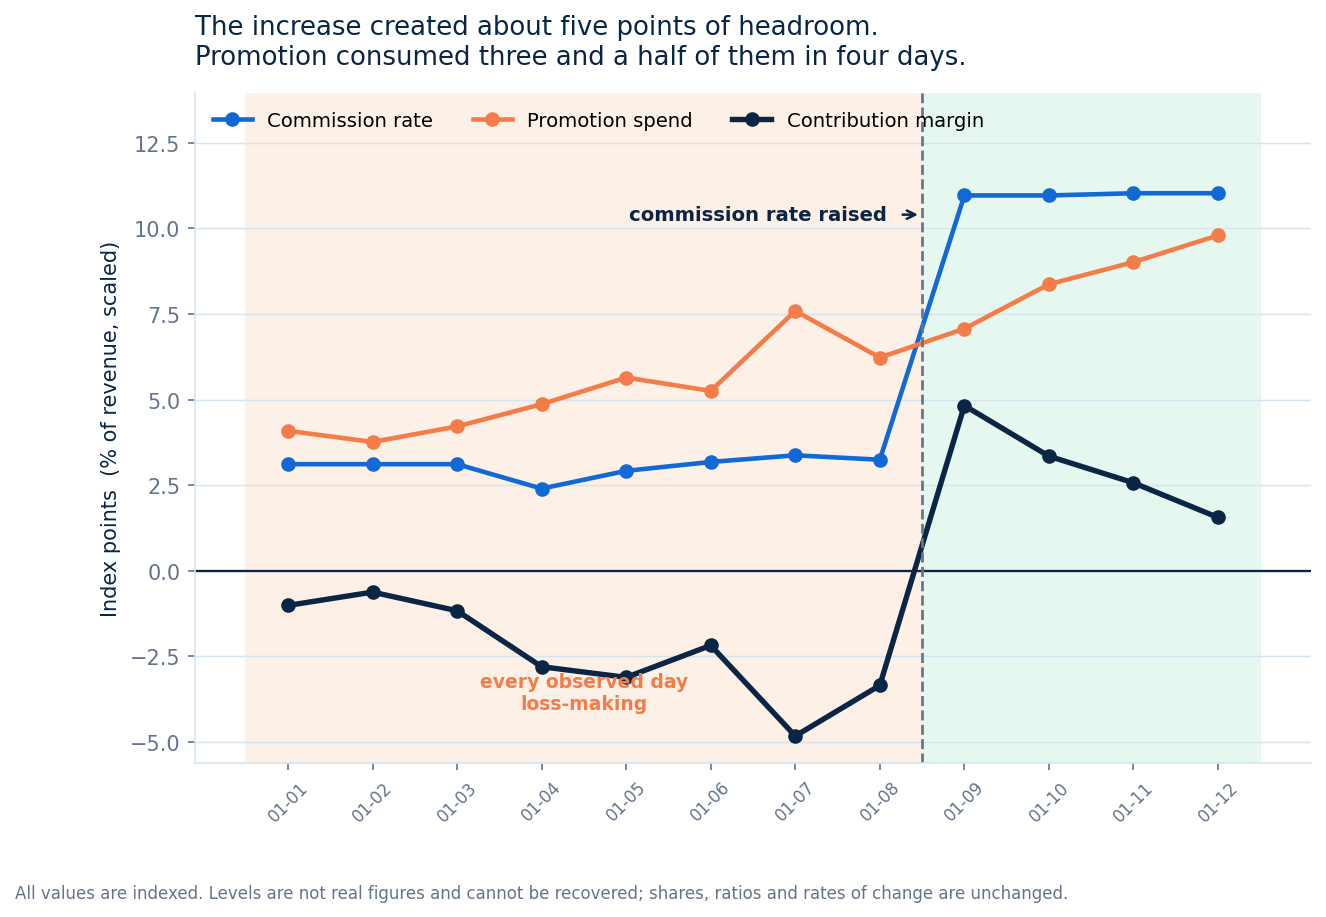
54 weeks across 8 acquisition channels, reconciling to the company total every week. A scope labelled “All Vietnam” turned out to be exactly two cities. Every published figure is indexed.

Python DuckDB CAC & payback Trade spend

Advertising

04Measurement / Experiment audit

2026 · Approximately 2 weeks · Sole contributor

Rokt — holdout experiment audit

852,197 records audited before any effect was estimated. 26,426 users appeared in both arms of a test that assumed one arm each, so the recommendation was a conditional rollout rather than a green light.

Python Two-proportion z-test Sensitivity analysis

Fintech

05Promotion spend / Decision rules

2026 · Approximately 1 month · Sole contributor

ZaloPay — promotion budget concentration

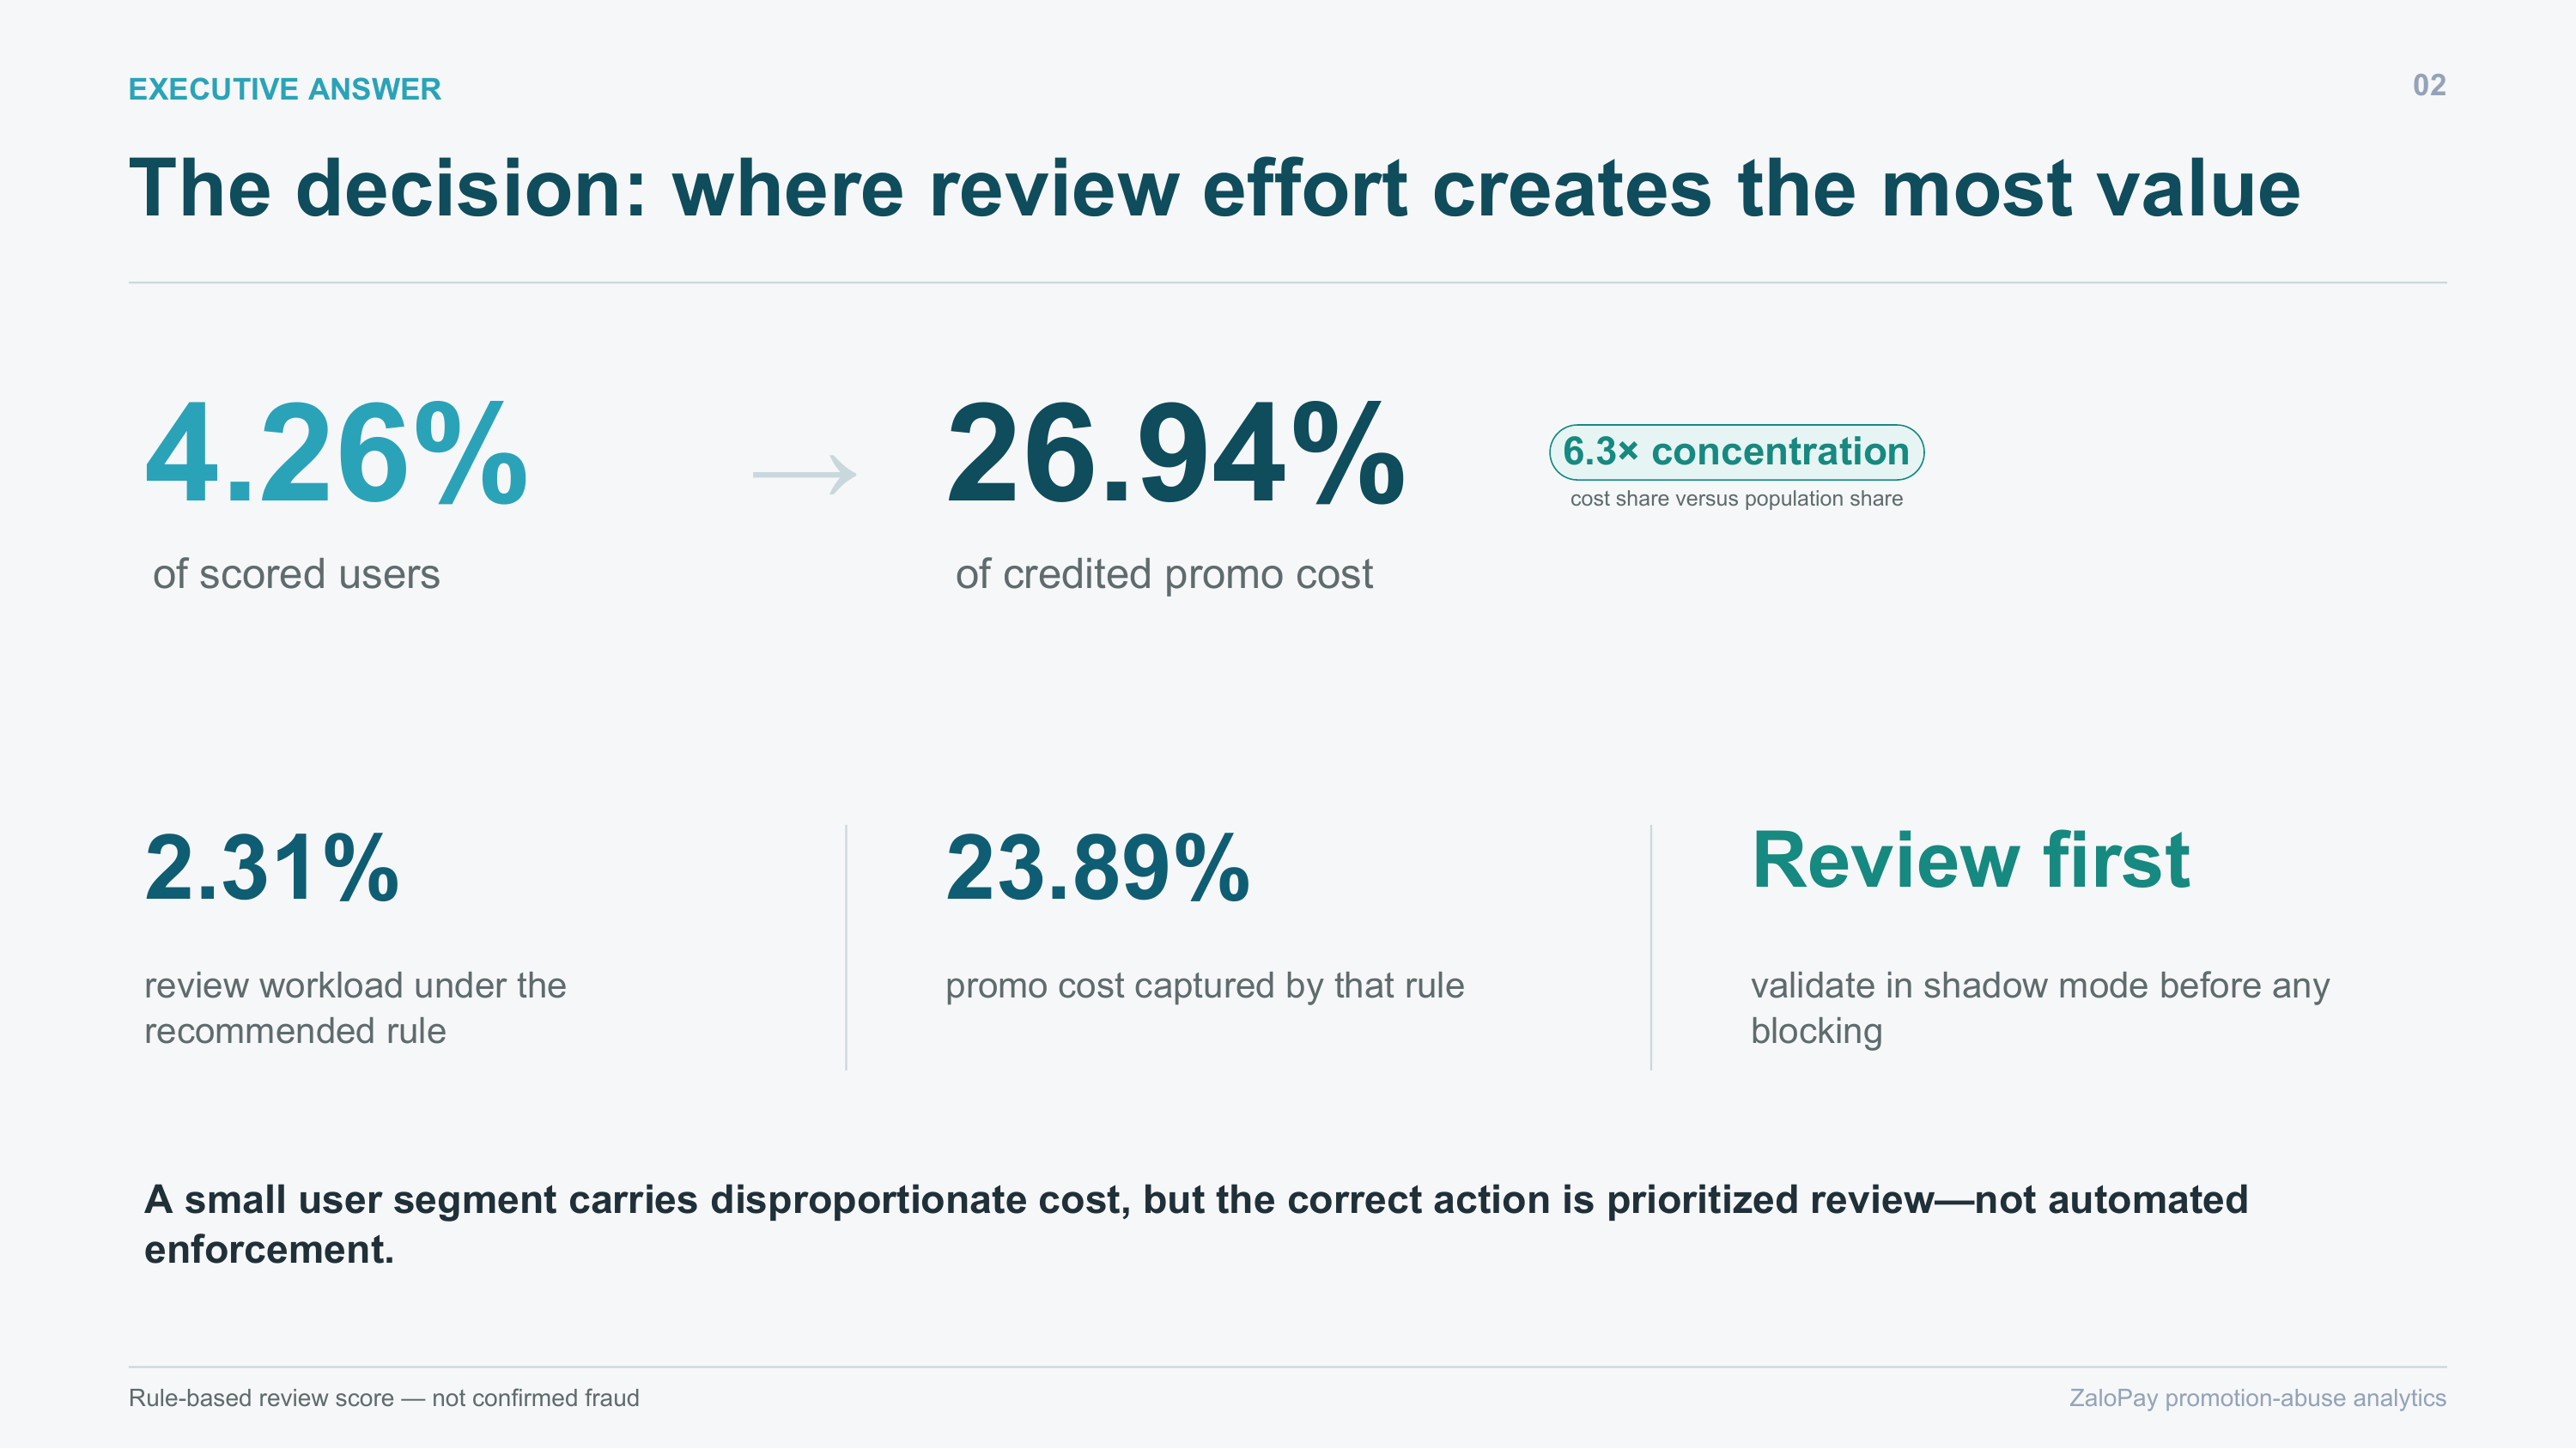
4.26% of scored users are associated with 26.94% of credited promotion cost. Recommended a shadow-mode review queue rather than auto-blocking, because the data carries no fraud labels.

T-SQL Python Power BI Cost coverage
Also in the repository

A bank-marketing targeting model — the top-ranked 20% captures 51.8% of responders at 2.59× lift while cutting outreach 80%, with a randomised pilot recommended rather than deployment. The dataset is a widely-used teaching set and credit and risk is not a lane I am pursuing; what transfers is the targeting economics — capture, lift and contact cost against a fixed capacity — rather than the domain.

Open the case study

What it looks like in practice

Six times a number did not survive the check.

Each row is a figure that was reported, or about to be, and the check that changed it. Four of the six came out of my own work.

01

Dunnhumby: Coupon campaigns reduced household spend — six of 17 significantly

The comparison group spent 7× less before the campaign started. The parallel-trends test passed anyway, because it measures slopes rather than comparability. Matched on pre-period spend, every sign flips.

mart.campaign_effect · 17 campaigns, 6,407 treated households
02

BE Group: A scope labelled “All Vietnam”

Exactly Ha Noi plus Ho Chi Minh, to 100.000% in every month. No residual, so no third city. Read as national it would overstate coverage in every slide it reached.

qa.scope_reconciliation · 54 weeks, revenue and commission
03

TheLook: The forecast model was the best of three

It was — but it was chosen one month ahead and then run eight months ahead, on six folds that split three-three. A coin flip that landed right. Rebuilt to 192 rolling-origin folds.

docs/forecast_review.md · seven checks specified in advance
04

TheLook: Belgium’s plan variance looked normal

A sign error. Caught by the reconciliation statement, which has to balance, rather than by an eye scanning a chart.

qa.reconciliation_statement · 292 plan rows submitted
05

TheLook: Revenue concentration, Gini 0.58

17% of customers contributed zero net revenue — everything they bought was cancelled or returned. Excluding them: 0.49. Which population was used is stated wherever the figure appears.

artifacts/advanced_metrics.json · both populations reported
06

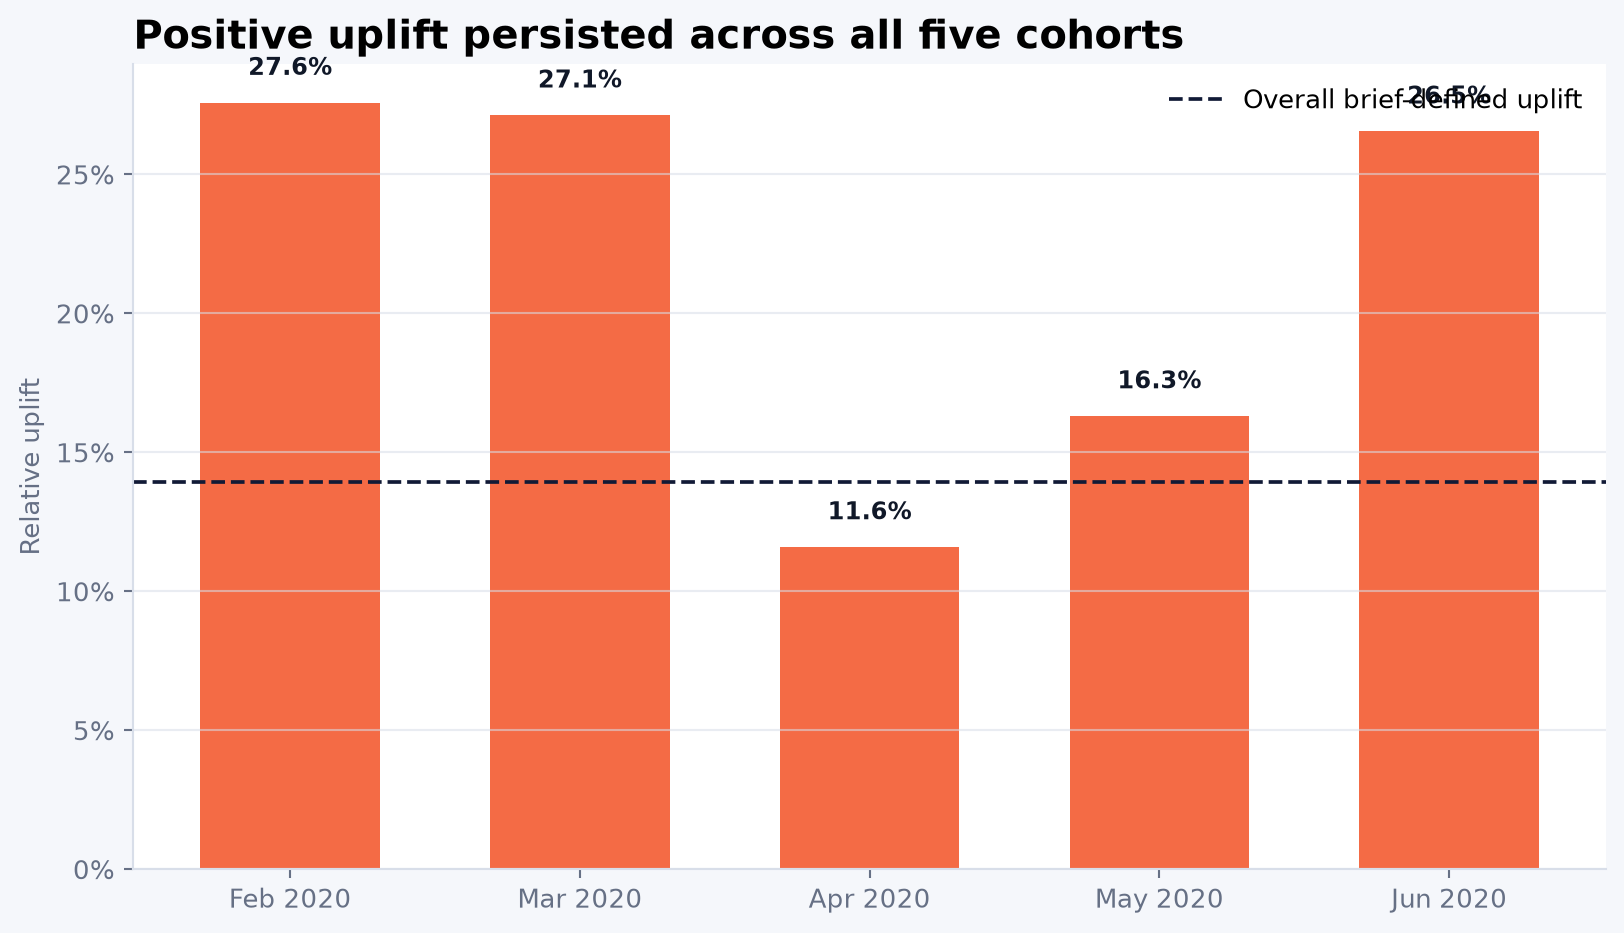
Rokt: +13.9% uplift, p = 3.4e-09

The randomisation unit could not be confirmed from the data supplied, and 26,426 users appeared in both arms. At user-cohort level the effect is +5.5%.

852,197 records · 36,893 duplicates removed first
The first row

A result can be wrong while the standard check that is supposed to catch it reports success. Parallel trends tests whether two groups move at the same rate; it says nothing about whether they are comparable at all. What exposed it was looking at the levels the two groups started from.

Query my portfolio

Do not take my word for it — query it.

Run SQL against a curated catalog of my projects, tools and published findings. This interactive demo uses portfolio metadata, not the underlying client datasets.

Demo data: a curated portfolio catalog. Counts have different grains and must not be summed across projects; null means undisclosed or not comparable.

portfolio_db

Press Ctrl+Enter to run · SELECT only

How I work

From a business question to a defensible decision.

My projects show this working approach at different depths. The decision determines which checks, methods and tools are needed.

01 / Frame the decision

Start with the choice someone needs to make.

Define the stakeholder, the unit being compared, the observation window and the action the evidence could support. Choose metrics around that decision: a limited contact queue needs capture and lift, not accuracy alone.

Bank targeting →

The top-20% contact band connects historical responder capture to a realistic campaign workload.

Decision brief

Decision boundary. State the outcome, capacity and evidence that would change the recommendation. Historical ranking does not establish campaign uplift.

  • SQL
  • Excel

02 / Check the evidence

Find the source issue that could change the answer.

Profile row counts, missing values, duplicates, types and distributions before interpreting the headline. Check feature availability at the time of a decision, and keep exclusions visible.

Rokt experiment audit →

Duplicate events and users appearing in both groups make the assignment grain a material uncertainty.

Source audit

Decision boundary. Separate a confirmed error from a sensitivity exclusion. If assignment or scoring-time provenance is unresolved, limit the claim.

  • GA4
  • BigQuery
  • SQL
  • Excel

03 / Build & reconcile

Make the grain and the totals agree.

Transform source tables into declared analytical grains. Reconcile totals, joins and denominators; compare independent calculations where available. Keep metric definitions close to the outputs.

TheLook retail BI →

2,420,661 events reconcile to 680,862 reconstructed sessions; retail measures feed the Power BI model.

Reconciled analytical tables

Decision boundary. A plausible chart is not a validation. Unexplained duplicate joins or totals must be resolved before interpreting a metric.

  • DuckDB
  • SQL
  • Python
  • pandas

04 / Test the interpretation

Show what the result can—and cannot—support.

Use uncertainty intervals and sensitivity views when the design supports them. Separate prediction, association and causal effect. Explain why a metric fits the data and record assumptions beside the result.

ZaloPay review simulation →

Rule comparisons balance credited-cost coverage, review capacity and potential customer impact; signals are not fraud labels.

Evidence with its limits

Decision boundary. An offline lift, flagged cost or model score is not realized value. Unmeasured uncertainty stays unmeasured; it is not a guarantee.

  • Python
  • scikit-learn
  • pandas
  • Excel

05 / Recommend & hand over

Leave a decision someone can inspect and test.

Lead with the recommendation, then its evidence and conditions. Document provenance, run steps and known limits. Specify the next check or controlled pilot; withhold rollout when the evidence is insufficient.

TheLook return model →

Near-chance held-out ranking led to a non-deployment recommendation and a need for better feature and outcome logging.

Decision report and handoff

Decision boundary. Review capacity, sensitive attributes and customer impact where relevant. A positive point estimate alone is not permission to scale.

  • Power BI
  • Looker Studio
  • Git
  • VS Code

Commercial background

Three years of being the person who reconciled it.

Golden Owl’s agency and SaaS clients, Laptop SGN’s electronics retail, Canawan’s Etsy and Amazon marketplace. Campaign delivery, SEO and paid acquisition are where I learned the commercial questions — what a channel costs, what it returns, and when a number is being flattered by attribution. Client reporting belongs to the client, so what is here is the judgement behind the work rather than the files it was delivered in. I am not offering marketing as a service.

See the earlier marketing work →

  • Laptop SGN — 100,000 GA4 rows; the funnel leaked before checkout, not at it.
  • Turis VPN — topic-level conversion scoring separating traffic from intent.
  • LeaseRunner — GA4 and Search Console joined into one monthly decision surface.
  • Golden Owl CRO — blog-to-service progression and lead conversion reviewed together.
  • Golden Owl conversion — lead quality made visible by source, country and owner.

What others say

The read from someone who watched me work.

Quoted in full and unedited, from the mentor who ran the data analytics programme I completed in 2025.

I had the pleasure of mentoring Hoai Thu through my Data Analytics course, Thu joined track 2 which specialized for end to end data analytics project, and she is truly one of the most impressive students I’ve worked with.

From day one, Hoai Thu stood out for her self-driven attitude and ability to pick up complex concepts quickly — she never waited to be pushed. What impressed me most, however, was how she communicated her findings. Her project deliverables weren’t just technically solid; they told a clear story, turning data into insights that anyone could understand and act on.

The quality of her work consistently exceeded expectations — structured, thoughtful, and delivered with care.

I have no doubt Hoai Thu will bring that same energy and clarity to any data role she steps into. Any team would be lucky to have her.

Quoc-Hau Le Data Analytics Team Leader at MoMo · Ex-Shopee Founder & Mentor, Thehaudata.com Mentor · TheHau Data Analytics Programme · April 2026

What he singled out

Self-driven, never waited to be pushed Communicates findings so anyone can act Technically solid deliverables Consistently exceeded expectations

Verify on LinkedIn →

Education & credentials

Where the foundation came from.

UEH

Bachelor of Business Administration

University of Economics Ho Chi Minh City

2018 – 2022
TH

Data Analytics Mentoring Programme

TheHau · selected 15-person cohort

Mar – Jul 2025
7.5

IELTS Overall Band 7.5

Academic English proficiency

2022

Let us talk

Need an analyst who can connect the metric to the operating decision?

View contact detailsEmail directly