Real operating data · Channel P&L
BE Group — marketing channel economics
A mobility platform's reporting workbooks rebuilt into a pipeline — and a scope label that turned out to mean something narrower than it said.
- My role
- Independent analyst · Sole contributor
- Period
- 2026 · Approximately 2 weeks
- Engagement
- Business-analysis exercise for BE Group; completed individually. Real operating data, published indexed
Business objective: Assess acquisition efficiency, subsidy cost and payback by channel, and say what it would take to measure incrementality rather than guess at it.
My ownership: I completed the rebuild independently from end to end: parsed the source workbooks, built the decision tables, wrote the reconciliation checks, designed the indexed publication layer, and wrote the measurement design, recommendations and limitations.
Every figure on this page and in the repository is indexed. Levels are rescaled so the first period equals 100; ratios are multiplied by one undisclosed constant per metric family. Shares, rankings and rates of change survive unchanged — levels do not. No real operating figure is disclosed anywhere.
A mobility and delivery platform asked four questions as a business-analysis exercise: why installs and app-opens were diverging, which channel to cut if 20% of budget had to go, how to estimate the incremental impact of channel spend, and how to model ROAS and payback by channel.
They were answered in Excel. This is the rebuild — the same data, parsed reproducibly, with the checks the original could not carry.
Three operating workbooks rebuilt into a reproducible pipeline: 54 weeks × 8 acquisition channels, reconciling to the company total in 54 of 54 weeks. A scope labelled “All Vietnam” turned out to be exactly two cities, to 100.000% in every month. A commission increase bought roughly five points of contribution headroom, of which promotion consumed 3.4 within four days. Every published figure is indexed.
- Parsed a workbook nothing could read. Metrics down the rows, dates across the columns, merged headers, a second key hiding in column B, spacer rows and section banners inside the data. Four traps handled explicitly: inline subtotals that would double-count every aggregate (80 rows of 544), two dimensions stacked in one block, formulas in the first label of each block splitting one series into two, and reporting lags written into metric names.
- Kept the lag as a column.
(Lag T-2)on installs,(lag T-1)on new installs. The lag is part of the metric's definition — an install measured at T−2 cannot be divided by a signup at T−1 without shifting one first. Recorded rather than stripped, so the decision stays visible. - Four decision tables. Channel P&L by week with CAC, CPA and cost-to-income ratio; brand economics with take rate net of the discount the platform itself funds; per-trip promotion economics; and a payback model joining all three source files.
- Four checks before anything was quoted. The channel split reconciles to the company total in 54 of 54 weeks, worst delta 0.00004%. Reported CAC was verified against its own stated formula — 311 of 317 channel-weeks agree to within a cent.
What the evidence says
What it found.
A label that overstated its coverage
A scope named All Vietnam equals Ha Noi plus Ho Chi Minh to exactly 100.000%, in every month, on revenue and on commission. Not 99.4% — exactly 100%, meaning no residual and therefore no third city. Any share or growth rate taken from it describes two cities, and read as national it would be wrong in every slide it reached.
A commission increase, spent in four days
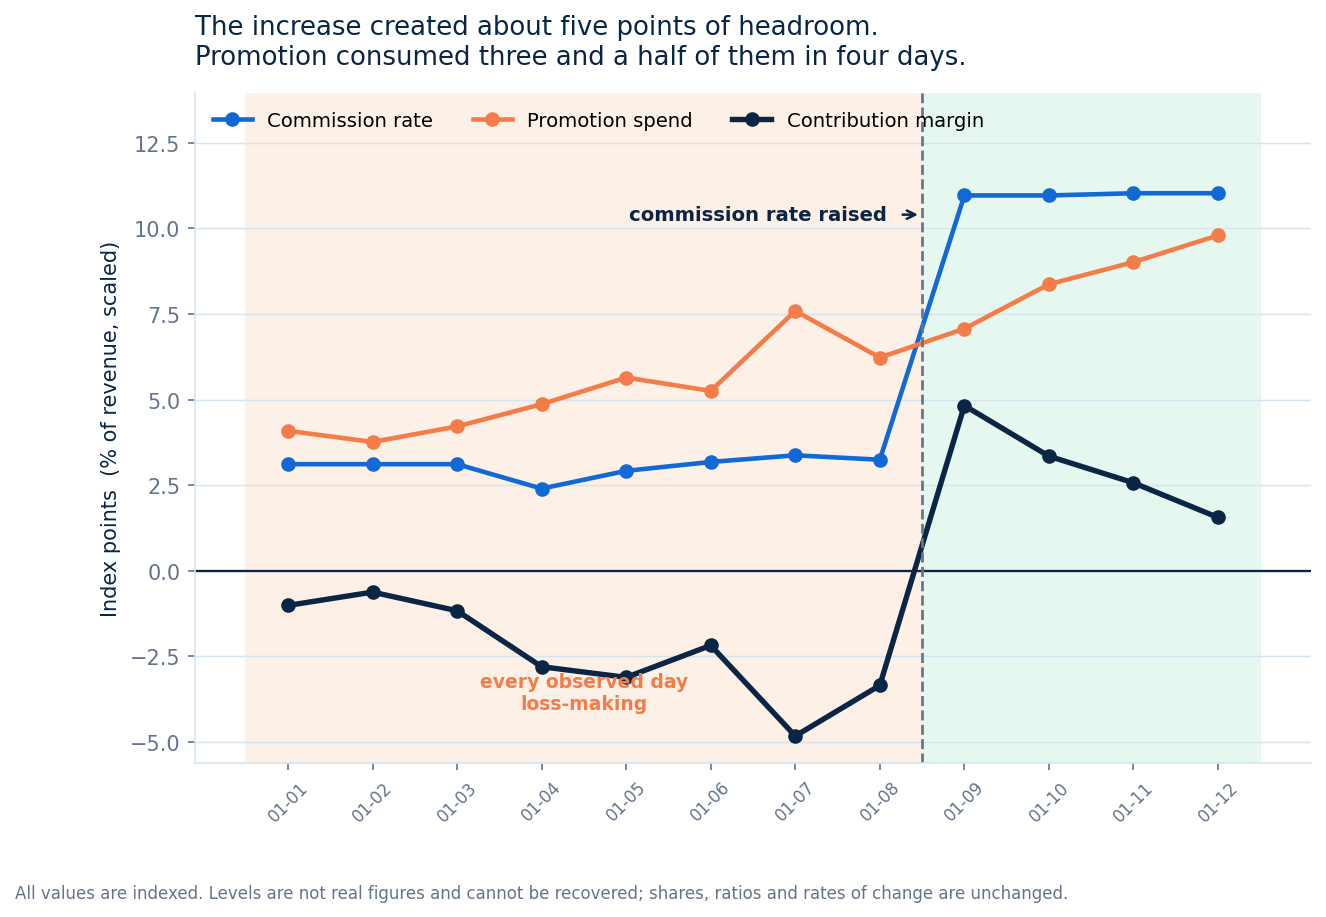
Every one of the eight observed days before the increase was loss-making on a contribution basis. The increase fixed that. But across the four days after it, margin fell 1.40 points per day while promotion rose 1.17 — roughly 3.4 of the 5 points of headroom consumed within four days. The finding is about pace, not level.
Seven brands losing money on a healthy-looking take rate
Commission and platform-funded discount sit in different columns in the source and are never subtracted. Net of its own subsidy, 7 of 55 brands are negative, carrying 11.2% of revenue.
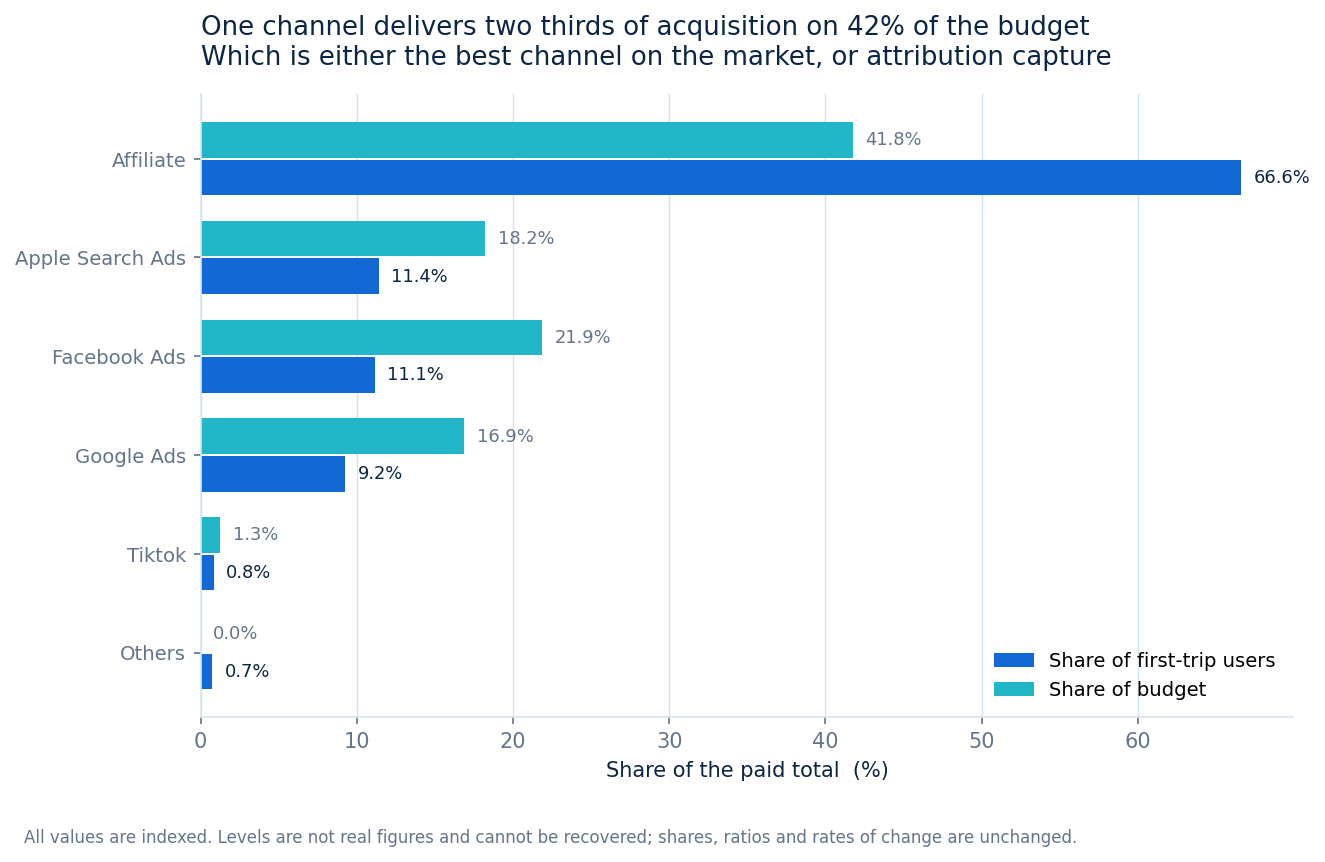
One channel at two thirds of acquisition, a third of the cost
Which is either the best channel in the market or attribution capture. Nothing in the data separates them — which is what the measurement design is for.
What it looks like
The output, not a description of it.
- Incrementality cannot be estimated from this data. Spend and demand move together, and the budget is set in response to performance — cause and effect are entangled by construction. A regression would return a confident coefficient and a meaningless number.
- So the deliverable is a design, not an estimate. A geo holdout, with the randomisation unit, the minimum detectable effect implied by a 0.221 coefficient of variation, and the constraint that decides whether it is viable at all — two city scopes cannot support it; it needs districts.
- The three files cover three different periods. The payback model combines them anyway, and says so.
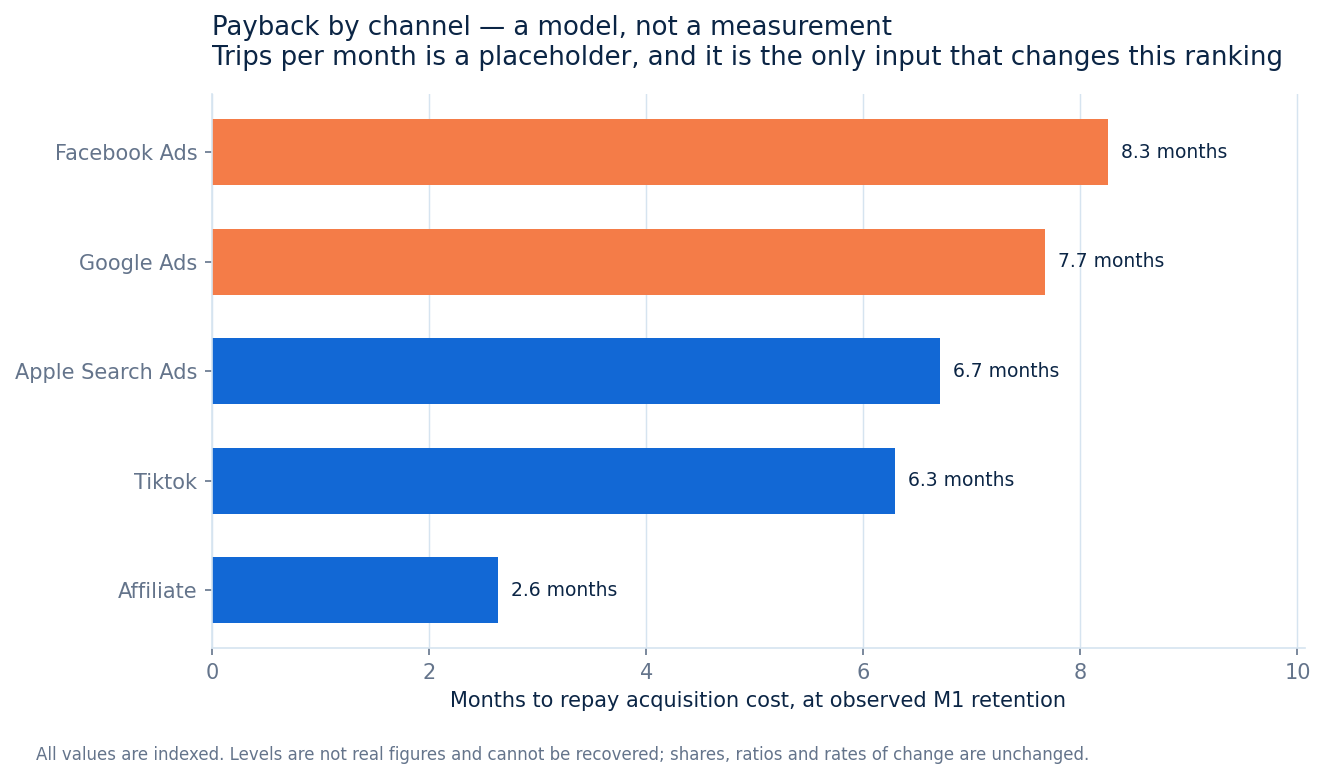
- Trips per month is a placeholder in the payback model and nothing in the data supports it. It is the only input that changes the channel ranking.
- One column could not be identified and is excluded from every calculation rather than guessed at.