Measurement · Causal
Rokt — holdout experiment audit
A significant result, audited rather than reported — and recommended conditionally because the randomisation could not be confirmed.
- My role
- Independent analyst · Sole contributor
- Period
- 2026 · Approximately 2 weeks
- Engagement
- Self-directed case study; completed individually
Business objective: Assess a campaign holdout result and the conditions needed for a defensible rollout decision.
My ownership: I completed this project independently from end to end: framed the question, prepared and validated the data, performed the analysis, built the reporting output, and wrote the recommendations and limitations.
An ad holdout test: one group saw placements, a suppressed group did not. Did showing ads increase conversion — and is the answer robust enough to roll out on?
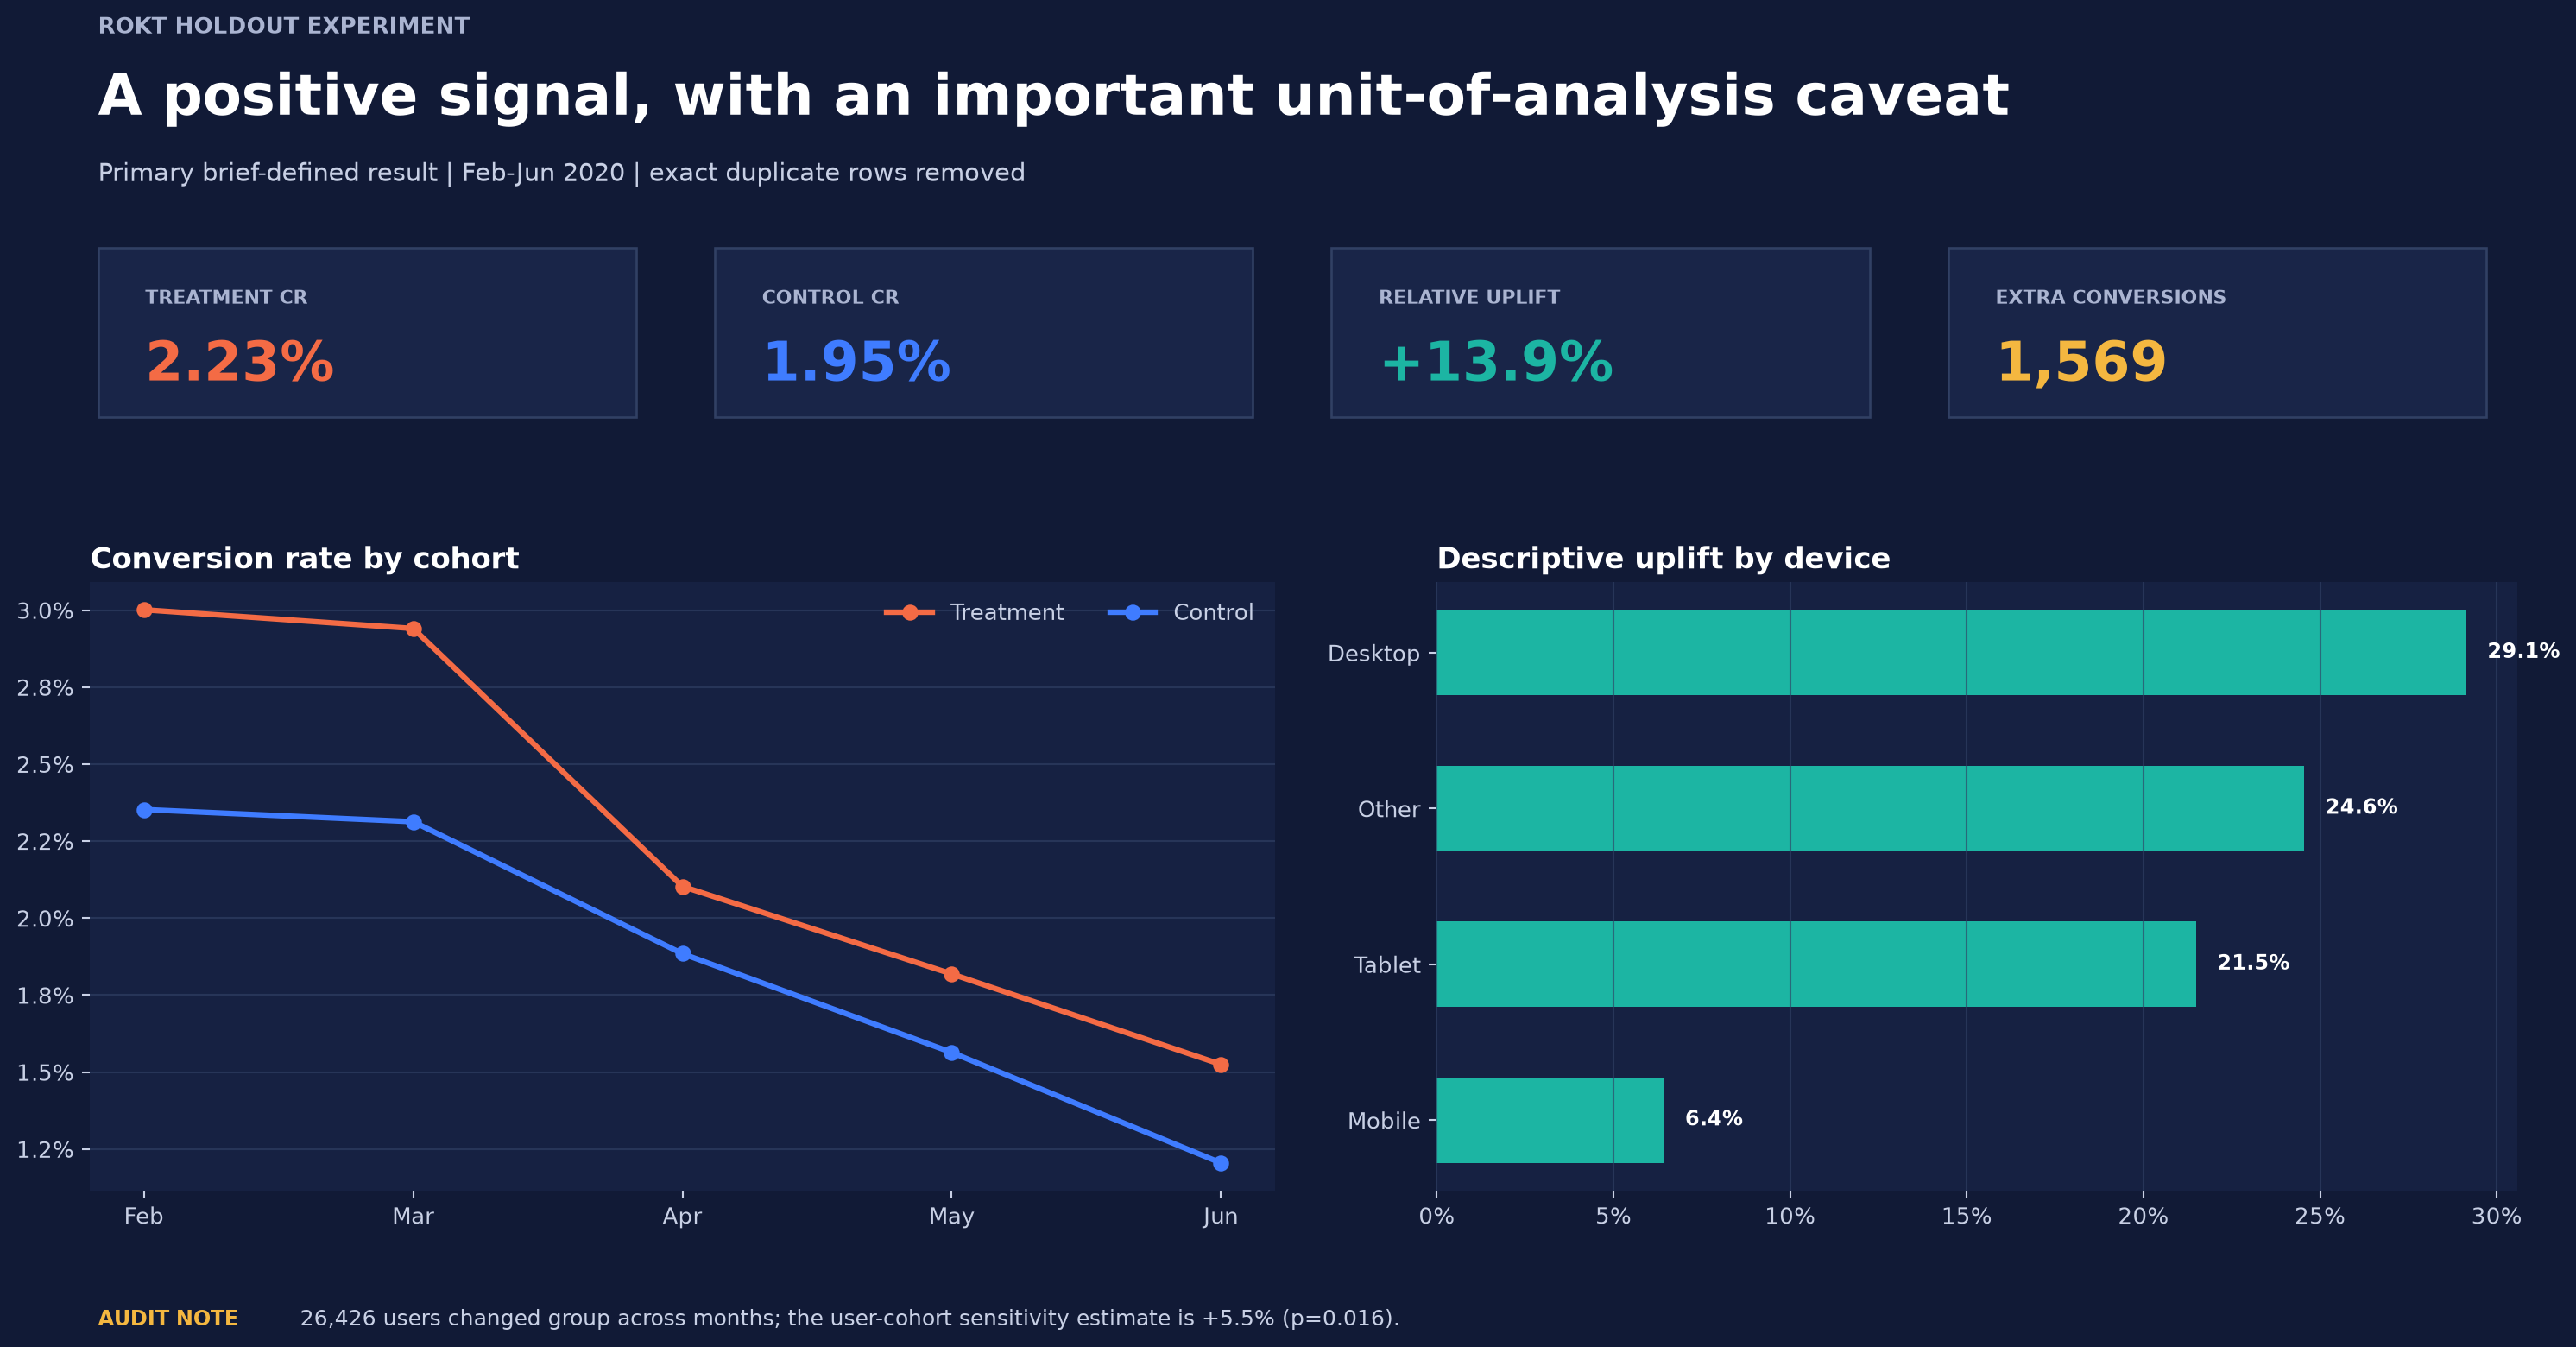
852,197 records audited before any effect was estimated: 36,893 exact duplicates removed, and 26,426 users found in both arms of a test that assumed one arm each. The headline +13.9% uplift (p = 3.4e-09) becomes +5.5% (p = 0.016) once the comparison is made at the level the assignment could support. The recommendation is a conditional rollout pending confirmation of the randomisation unit.
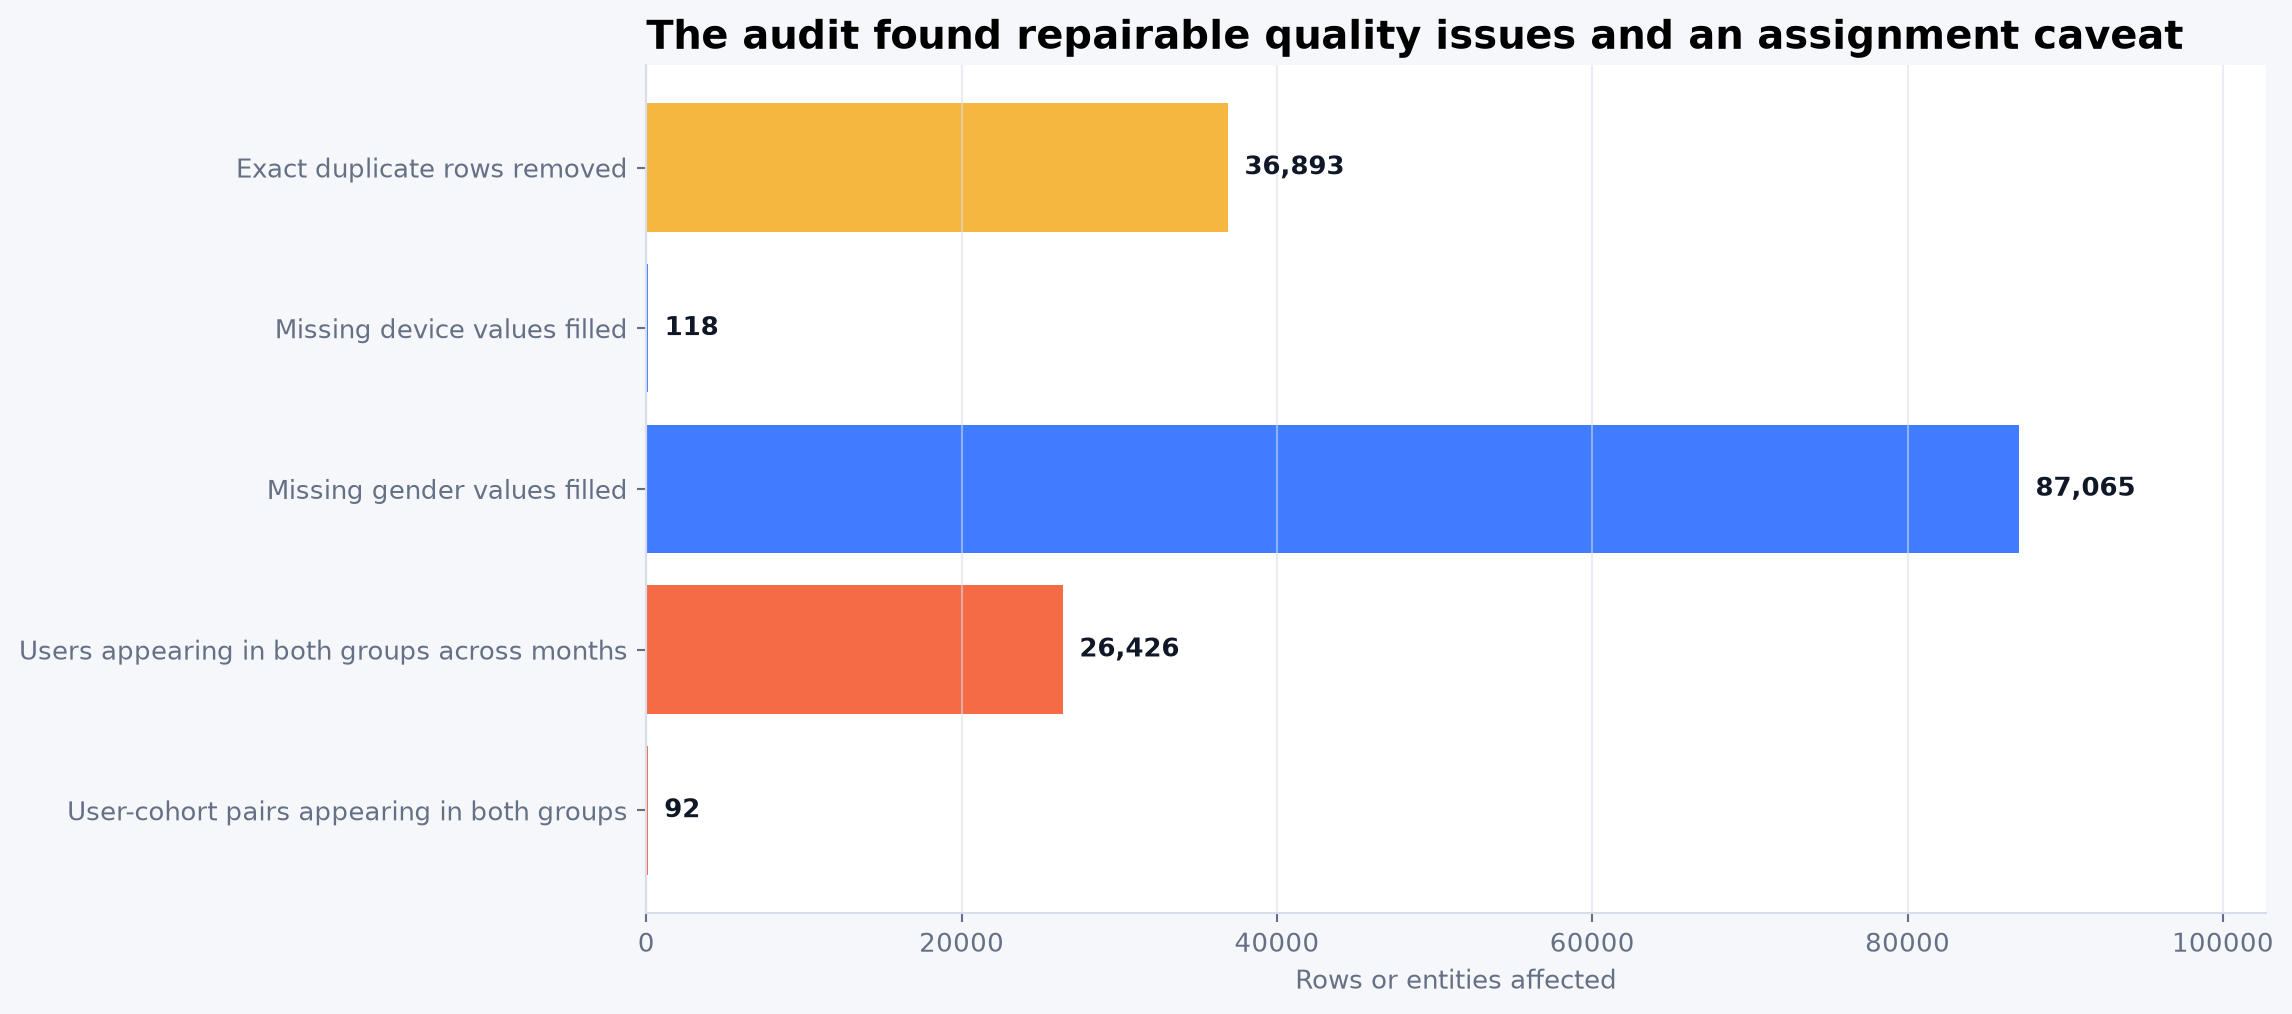
- Cleaned before estimating. 36,893 exact duplicate records removed. Estimating first and cleaning after is how a duplicate becomes a finding.
- Audited the randomisation unit. The analysis assumed users were assigned to one arm. 26,426 users appear in both. If assignment was at session level and analysis at user level, the standard errors are wrong and significance arrives too easily.
- Re-estimated at the level the assignment could support. Two-proportion z-test on the headline, then the same comparison re-run at user-cohort level as a sensitivity analysis.
What the evidence says
What it found.
The headline held, smaller
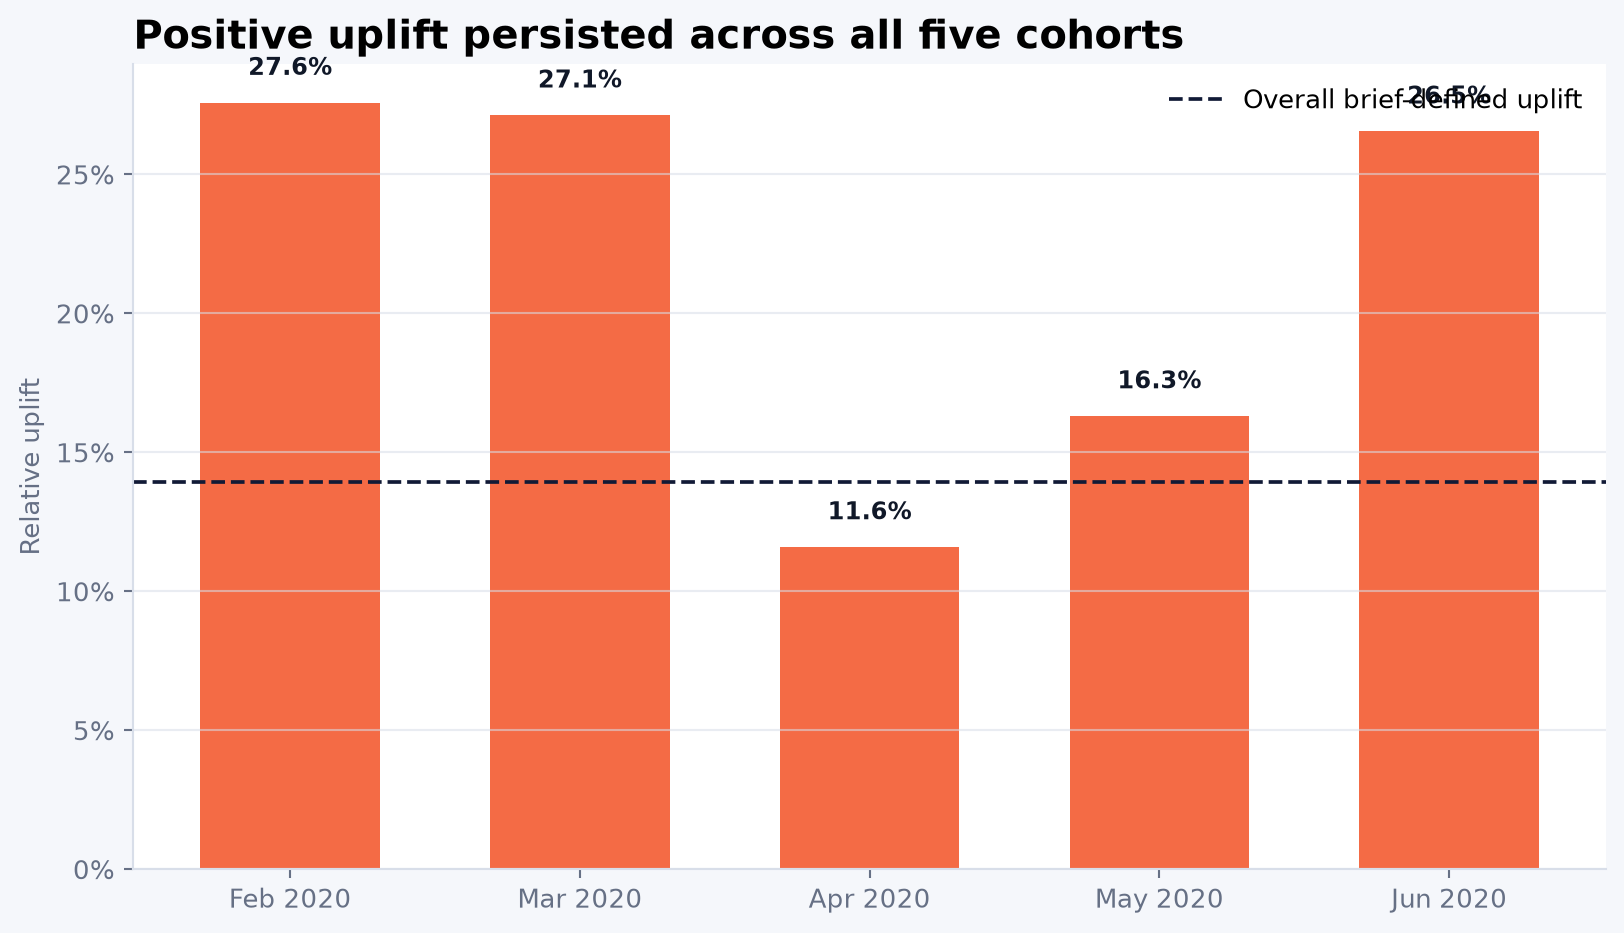
+13.9% relative uplift, 95% CI +9.1% to +19.0%, p = 3.4e-09. At user-cohort level: +5.5%, p = 0.016. Still positive, still significant, and roughly a third of the headline.
The recommendation was weaker than the statistics allowed
Conditional rollout, pending confirmation of the randomisation unit — rather than treating p = 3.4e-09 as sufficient evidence. A p-value answers whether an effect is distinguishable from noise. It says nothing about whether the comparison was valid.
What it looks like
The output, not a description of it.
- The randomisation unit was never confirmed. The audit established that it could not be verified from the data supplied, which is a different thing from establishing that it was wrong.
- The sensitivity analysis is a bound, not a correction. It shows what the estimate becomes under a stricter assumption; it does not recover the true effect.
- One metric, one window. No check on whether the uplift persisted, and no guardrail on downstream value.