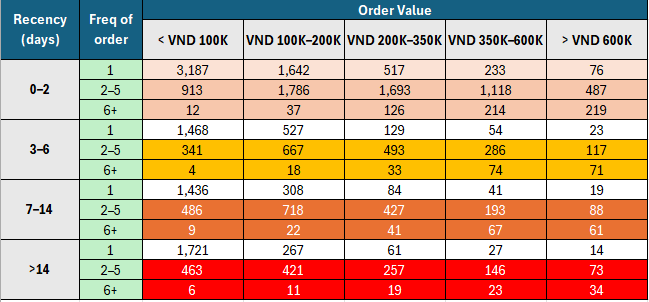
Laptop SGN E-commerce Analytics
A 100,000-row GA4 analysis showing the funnel leaks before checkout, not at it, and identifying retention opportunities for a controlled test.
Commercial background
Five analyses delivered inside agency and in-house marketing roles between 2022 and 2025. They sit behind the data and BI work on this site deliberately: this is the commercial context that taught me which questions are worth answering, before I built the technical depth to answer them with SQL, Power BI and Python.
The through-line
Across e-commerce, SaaS and B2B services, the pattern repeated: the highest-volume traffic is rarely the highest-value traffic, and the leak is almost never where the team assumed it was. Each case below states the question, the evidence, and the decision it supported.
A 100,000-row GA4 analysis showing the funnel leaks before checkout, not at it, and identifying retention opportunities for a controlled test.
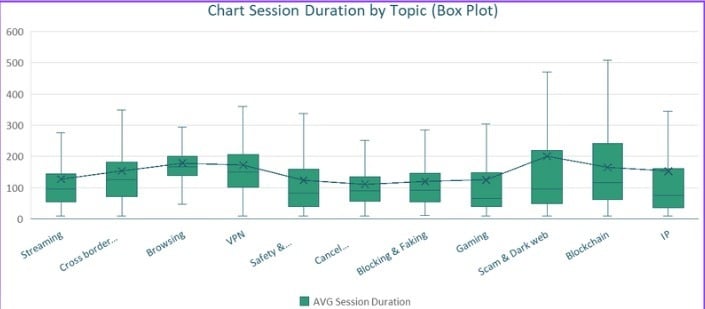
Topic-level conversion scoring that separated high-traffic content from high-intent content, plus a fairer time-on-site method.
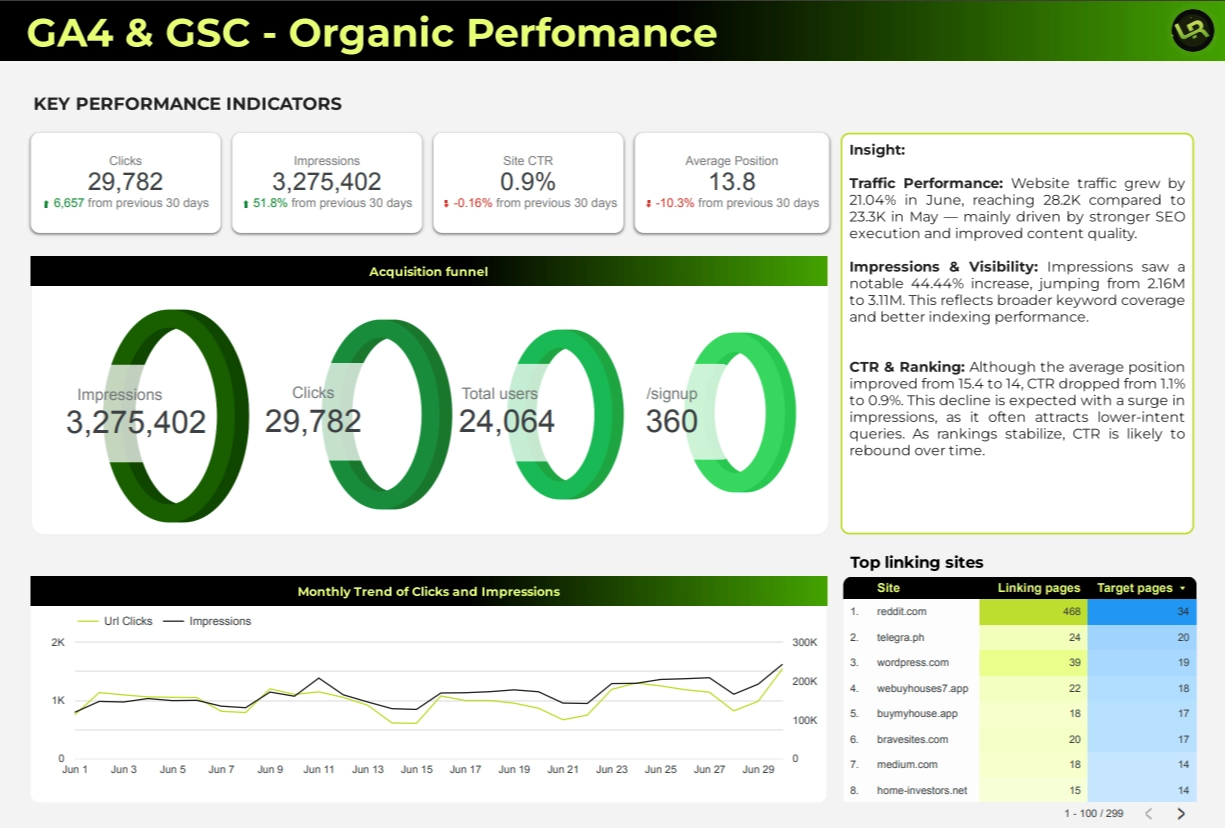
A Looker Studio dashboard joining GA4 and Search Console so acquisition, visibility and signup conversion read from one surface.
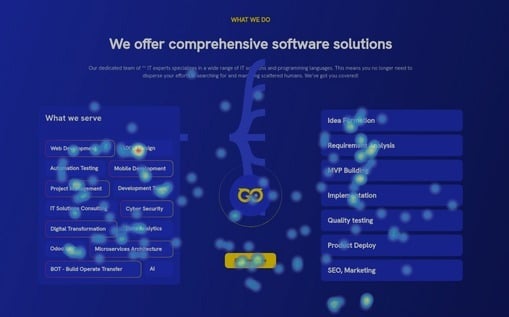
A million blog sessions converting at 0.11% into service pages — diagnosed with GA4 and Hotjar, then rebuilt into an eight-part roadmap.
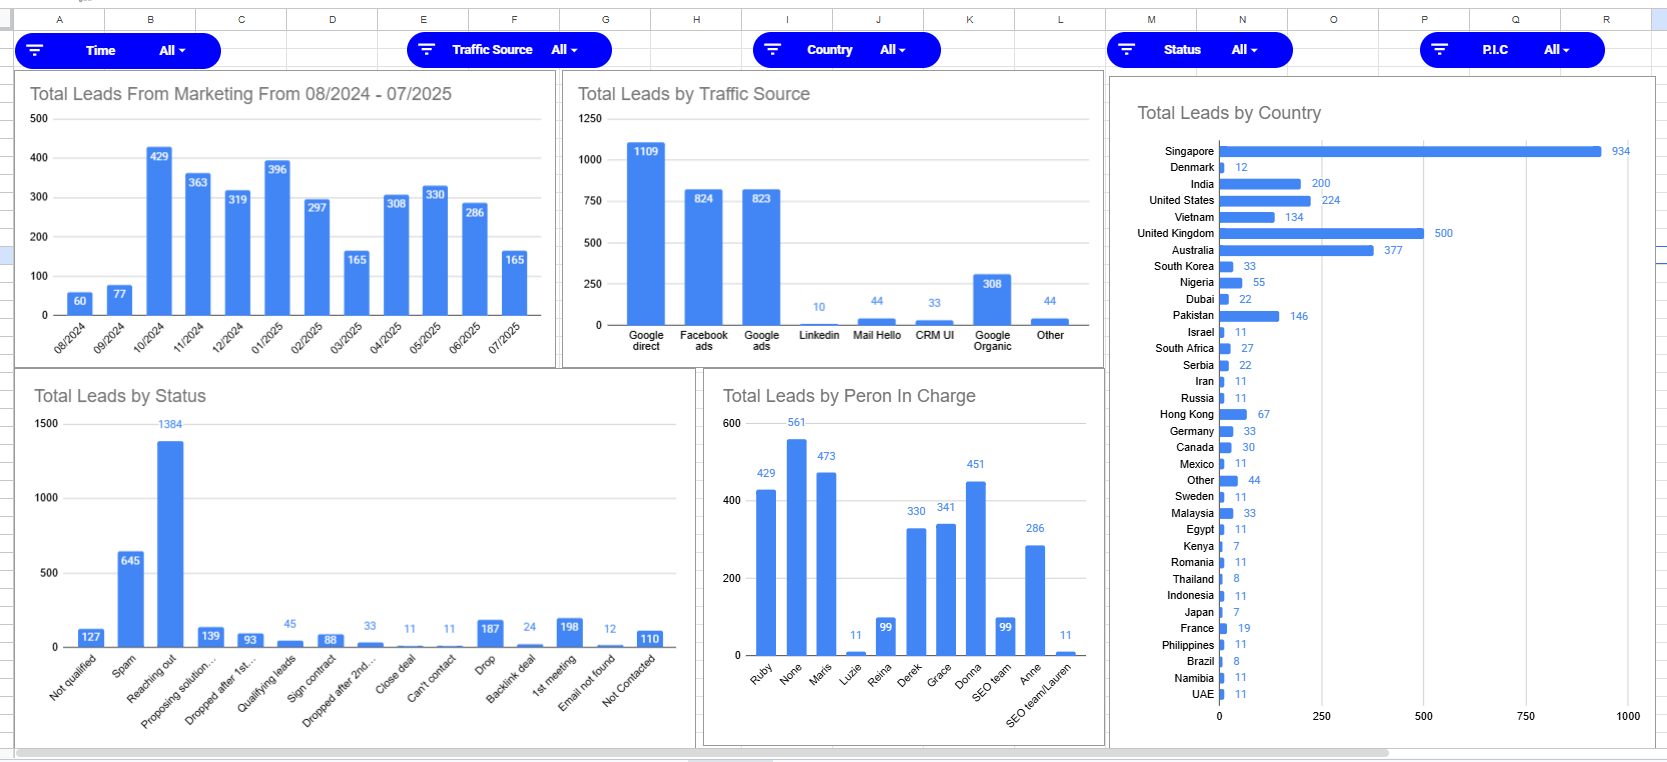
A shared sales and marketing view connecting source, country and sales owner to lead quality rather than lead volume.
How to read these
Each case names the data source and window, separates what was measured from what was estimated, and states what the analysis does not prove. Where a client deck contained personal contact data, those screenshots are withheld and the finding is described instead.
The technical layer